I got interested in TL speakers when I built a pair of Fried C3/Ls in the early 90s. It's a small TL design that looks something like a Wilson WATT. (I could probably scan the plans if anyone is interested.)
Anyway, I've been lurking around here for a while learning things (like you have to turn off Norton scripting to run Martin King's worksheets-- Thanks) but I still have some questions.
I decided to build the Thor TLs, but after reading some of the posts here, I want to modify the cabinet design. Rather than increasing the depth to 23 inches or so, I thought of bowing out the sides to increase the area behind the drivers and still maintain the same width front baffle and a reasonable depth. I think this could be done with 1/4 MDF laminated to the necessary thickness. The biggest problem is that the interior baffle becomes very complicated.
I tried to model the design on Martin King's worksheets but I get different results using the offset driver worksheet and the TQWT worksheet and I can't figure out why. I understand they are supposed to be the same.
Here is what I used for input parameters:
Fd 31
Re 3.05
Lvc .20
Bl 7.2
Sd 252 cm
Vd 74
Qed .39
Qmd 2.5
This represents a composite of the two mid bass drivers.
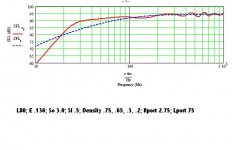
Here is what I used for the geometry of the cabinet in the Offset driver worksheet:
L: 82
position ratio 11 inches (As I understand it, in the offset driver sheet this is expressed in INCHES from the top of the cabinet even though the sheet refers to a ratio, while in the TQWT worksheet this is actually a dimensionless ratio. Is this correct? This position is where the tweeter would go in between the two mid-bass drivers.)
So 2.75 (this as about 107 sq inches)
Sl .5 (this gives me a taper ratio of 5.5 to1)
density .3 lb/ft^2
I used identical inputs for the TQWT worksheet except as follows:
Position ratio: .134 (this is the same as the other except converted to a ratio 11/82. Is this correct?)
I kept So and Sl the same even though the TQWT worksheet says So is the small end because in my design, unlike a regular TQWT, the taper decreases. Is this correct?
For Lport, I put .001 since there is no port.
For R port, I assumed that the worksheet is converting a radius to an area (pi*R^2), so I took the area of the open end of the line and divided by Pi and took the square root to get an equivalent to put in the worksheet. I input 2.75. Is this correct?
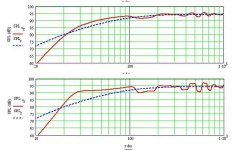
I expected the system response graphs to look the same but they don't. If someone will tell me how, I'll post the graphs (a picture is worth a thousand words).
Basically, though, the offset driver graph intersects the infinite baffle graph at about 23 hz and shows about a 2-3 db gain over the infinite baffle up to about 125 hz where it again intersects the infinite baffle graph.
In contrast, the TQWT graph intersets the infinite baffle graph at about 18 hz, rises steeply from there to about an 8 db gain over the infinite baffle response at about 28 hz and then flattens out so there is about a 2 db gain at 100 hz.
Both graphs take a dip at about 125 hz but the ripples in the TQWT graph are more severe than the offset driver graph.
Sorry for the long post, but I'd really like some comments on the proposed design, some advice as to whether I am using Martin King's worksheets correctly, answers as to why the two worksheets give different results and some suggestions for improvements. Thanks.
Anyway, I've been lurking around here for a while learning things (like you have to turn off Norton scripting to run Martin King's worksheets-- Thanks) but I still have some questions.
I decided to build the Thor TLs, but after reading some of the posts here, I want to modify the cabinet design. Rather than increasing the depth to 23 inches or so, I thought of bowing out the sides to increase the area behind the drivers and still maintain the same width front baffle and a reasonable depth. I think this could be done with 1/4 MDF laminated to the necessary thickness. The biggest problem is that the interior baffle becomes very complicated.
I tried to model the design on Martin King's worksheets but I get different results using the offset driver worksheet and the TQWT worksheet and I can't figure out why. I understand they are supposed to be the same.
Here is what I used for input parameters:
Fd 31
Re 3.05
Lvc .20
Bl 7.2
Sd 252 cm
Vd 74
Qed .39
Qmd 2.5
This represents a composite of the two mid bass drivers.
Here is what I used for the geometry of the cabinet in the Offset driver worksheet:
L: 82
position ratio 11 inches (As I understand it, in the offset driver sheet this is expressed in INCHES from the top of the cabinet even though the sheet refers to a ratio, while in the TQWT worksheet this is actually a dimensionless ratio. Is this correct? This position is where the tweeter would go in between the two mid-bass drivers.)
So 2.75 (this as about 107 sq inches)
Sl .5 (this gives me a taper ratio of 5.5 to1)
density .3 lb/ft^2
I used identical inputs for the TQWT worksheet except as follows:
Position ratio: .134 (this is the same as the other except converted to a ratio 11/82. Is this correct?)
I kept So and Sl the same even though the TQWT worksheet says So is the small end because in my design, unlike a regular TQWT, the taper decreases. Is this correct?
For Lport, I put .001 since there is no port.
For R port, I assumed that the worksheet is converting a radius to an area (pi*R^2), so I took the area of the open end of the line and divided by Pi and took the square root to get an equivalent to put in the worksheet. I input 2.75. Is this correct?
I expected the system response graphs to look the same but they don't. If someone will tell me how, I'll post the graphs (a picture is worth a thousand words).
Basically, though, the offset driver graph intersects the infinite baffle graph at about 23 hz and shows about a 2-3 db gain over the infinite baffle up to about 125 hz where it again intersects the infinite baffle graph.
In contrast, the TQWT graph intersets the infinite baffle graph at about 18 hz, rises steeply from there to about an 8 db gain over the infinite baffle response at about 28 hz and then flattens out so there is about a 2 db gain at 100 hz.
Both graphs take a dip at about 125 hz but the ripples in the TQWT graph are more severe than the offset driver graph.
Sorry for the long post, but I'd really like some comments on the proposed design, some advice as to whether I am using Martin King's worksheets correctly, answers as to why the two worksheets give different results and some suggestions for improvements. Thanks.
Attachments
Did you check to make sure that the fiber damping is applied in the same way in both models? This is done by checking the data input on the second page under the stuffing density column. In the "TL Offset Driver" worksheet, the line is completely filled. In the "ML TQWT" worksheet, the stuffing is only in the top half of the line. I think what you are seeing is the same model geometry but with two different distributions of the fibers. The "TL Offset Driver" model has a lot more damping.
Hope that helps,
Hope that helps,
Aha! That explains it. In the TQWT model the closed end of the line says Dc:= Density While the open section says Do:= 0.0 lb ft.
Thanks. Can you tell me how to input different densities at different locations in the line model? And do you have any suggestions for the best way to stuff the line before I start trying random things? Should the density be equal throughout, denser in the closed end or denser in the open end?
I'd like to damp the ripples above 100 hz without supressing the bass as much as is shown in the Offset driver model with uniform stuffing.
One other thing, Martin, I read in one of your posts some time ago that you were thinking of doing a model for two drivers in different positions so an average location would not have to be used. Are you still working on that?
The worksheets are set-up to fill in the table of geometry on the second page by minimal inputs on the first page. This was done to make it easy to use. But as you become more comfortable with the worksheets there is nothing to prevent you from entering data by hand on the second page. So to model different stuffing densities and placements edit that column.
I have gotten good results by only stuffing the first 2/3 or 3/4 of the line and leaving the last 1/3 to 1/4 empty. This will suppress the higher modes without attenuating the findamental as much.
The two driver worksheet is on my list of things I would like to model but it has very low priority. I don't build MTM configurations so it really is not too interesting other then the math challenge. Also, I have been rethinking making the newer worksheets available for free, people have been taking advantage. So even if I do put this particular worksheet together, I doubt it will be made available.
I, personally, stuffed my line as densely as possible just behind the driver, I think starting about 2 inches back. The stuffing, then, extended about halfway through the line.
I've had great results so far in their application as studio monitors! The rolloff for my pipe is very gradual, starting around 55Hz to something pretty low (I didn't write it down, so it could have started around 50 or even lower--I can't remember).
http://www.diyaudio.com/forums/showthread.php?s=&threadid=12769&highlight=
Dave
- Status
- This old topic is closed. If you want to reopen this topic, contact a moderator using the "Report Post" button.
- Home
- Loudspeakers
- Multi-Way
- Transmission line - Advice appreciated