Right! Do NOT measure the pink noise with the volt meter. Measure the pink noise with the SPL meter, then run the test tone and measure it. But beware. The test tone is going to be LOUD once you've set the pink noise to 85dB. How loud? Should be 6dB louder, or 91dB. Don't try this at 3:00 AM while the rest of the house is asleep.
Maybe I should make a -18dB sine wave?
EDIT: And here they are. 120Hz and 220Hz at -18dBfs MP3 inside a Zip
These are 6dB lower than the original tones, or 1/2 the voltage.

Ok, ran the -18db pink at 85dBc then switched to the -12db 220Hz sine wave. Which was at 91dBc got 1.44VAC.
I'll try the -18dB 220hz sine next.
Last edited:
.87 watt sounds about right for your 120db/1w/m speaker system .....")
well that's with 7 identical mains
We could use -20, but the new SMPTE and EBU standards are set at -18dB, so we can stick with that.
I actually agree with a.wayne here, the magnitude of the sine wave has no importance whatsoever providing we know what it is. Using -20dB shouldn't be a concern to most volt meters when the system has been calibrated for 85dB with pink noise as it should be turned up quite loud. -20dB is a good figure to use simply because the multiplication back up to 0dBfs is so simple = x10. The -18 multiplication is x7.944, which is close enough to being 8 only it isnt
Ok, ran the -18db pink at 85dBc then switched to the -12db 220Hz sine wave. Which was at 91dBc got 1.44VAC.
I'll try the -18dB 220hz sine next.
With the -18dB 220Hz sine wave at 85db got .43VAC
20log (1.44/0.430) = 10.5 = 10.5dB difference. Something isn't right here, the two voltages should show a difference of 6dB. So either your volume control was in a different place the second time round, or your volt meter is botching the measurement.
Edit - just noticed your edit!
20log (1.44/0.72) = 6.02dB. Okay, excellent now we're getting some decent data
Here's the point though. Having done the test, you have set the volume control using the pink noise and an SPL meter, once the SPL meter says 85dB you stop increasing the volume. This is akin to setting the volume using music and your ears. The music acts as the pink noise and your ears act as the SPL meter, only in this case you stop advancing the volume when your ears say stop.
Now lets take the -12dB tone. You ended up measuring 1.44Vrms on your multimeter. What we are interested in though really is the voltage when your amplifier is called on to reproduce digital zero or 0dBfs. In this case the -12dB voltage needs scaling up by 12dB, to do this we multiply the voltage by 4. In this case we end up with 5.76Vrms. Or in other words you need 4.1, 8ohm resistive watts for full scale digital output.
Now lets take the -18dB tone. Here you ended up measuring 0.72Vrms. Again what we want is the voltage your amplifier is asked to output with 0dBfs. In this case we have to multiply the voltage by 7.994. 0.72*7.994 = 5.76Vrms. In other words the end result is exactly the same. The magnitude of the test tone is irrelevent to the end point that this test is trying to reach. Hopefully this will help to show people that the 4x -12dBfs signal is nothing more then a tool or measurement point, just as the -18dB tone is, it isn't a representation of an average to peak level
Last edited:
20log (1.44/0.430) = 10.5 = 10.5dB difference. Something isn't right here, the two voltages should show a difference of 6dB. So either your volume control was in a different place the second time round, or your volt meter is botching the measurement.
I figured that, found the problem and corrected the above post.
I figured that, found the problem and corrected the above post.
Indeed I noticed your edit and edited my post above
Yeah, I know, I know. But what we don't need is yet more test signals. Look at how hard it has been to get people to understand this dead simple test. It should be simple for folks to figure out what's going on from ANY sine wave, but that has not been the case.-20dB is a good figure to use simply because the multiplication back up to 0dBfs is so simple = x10.
-18dB is a standard level and it has the advantage of letting you know directly what voltage it takes for you to reach 85dB SPL after you've run the pink noise.
Yeah, I know, I know. But what we don't need is yet more test signals. Look at how hard it has been to get people to understand this dead simple test. It should be simple for folks to figure out what's going on from ANY sine wave, but that has not been the case.
-18dB is a standard level and it has the advantage of letting you know directly what voltage it takes for you to reach 85dB SPL after you've run the pink noise.
Indeed
and good point How did you get 1.47w? distance ~2.5m from the three fronts ~2m from the sides and ~3m from the rears. I did measure at 1m from the front right main 85dBc before measuring the voltage for the -18dB 220Hz sine. this room has a lot of absorption built in, 6" of medium density closed cell foam covering the walls under the drapes.
Then it's hard to tell how resistive your room is , but your speakers may have an anechoic rating or 86db/1w/1m ... well if the numbers you gave me were correct..
@ Pano: I'm assuming 8 ohm nominal speakers .....
Then it's hard to tell how resistive your room is , but your speakers may have an anechoic rating or 86db/1w/1m ... well if the numbers you gave me were correct..
@ Pano: I'm assuming 8 ohm nominal speakers .....
You are correct 8 ohm.
As we've had active loudspeakers mentioned quite a bit here it's worth examining them in a little more detail perhaps as my loudspeakers are active too.
Below you will see the transfer function/gain of the individual networks within the main three way part of the loudspeaker.
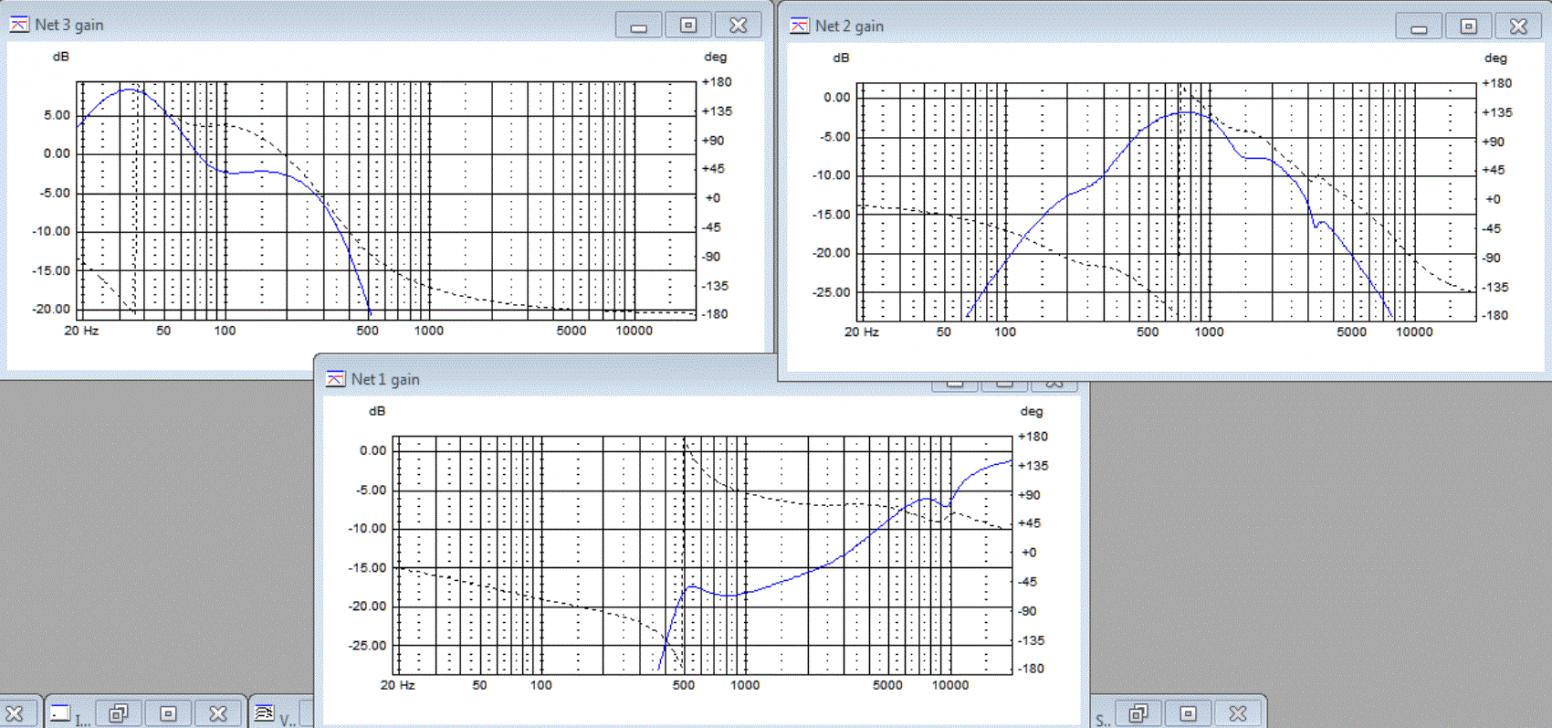
As can be seen the gain varies by a huge amount vs frequency over the bandwidths that the drivers are asked to reproduce and as a result the voltage the amplifiers will be asked to reproduce vs 0dBfs will also change considerably depending on the frequency. So what do you do?
First lets look at the midrange driver (net gain 2) as this is the easiest one to make this work for. It can be seen that the point of maximum gain for the midrange is at around 750hz. This is useful because music easily has the potential to contain a lot of energy at this frequency. As a result it would make sense to run this test for the midrange driver at 750hz and it would give accurate results.
Next lets look at the tweeter (net gain 1). Here we've got a huge problem. As you can see the gain goes up as frequency increases (and by a large amount too), but at the same time we know that on the whole music contains less and less energy the further up in frequency you go. If I wanted to play this on the safe side I could measure at 20khz, but by doing this I would probably oversize my amplifier requirements considerably. If I did the measurement at 10khz for example I would need an amplifier with half the voltage swing then if I had done the test at 20khz.
It's similar for the bass driver too, here there's a LT circuit in place that adds a peak of gain at 35hz. But once again most music doesn't have a lot of content down that low, but then again some will. Here I am saved by the laws of physics though because in its specific cabinet that driver runs into xmax with around 28Vrms, which is what the amplifier can provide, so in that sense it's an easy enough task to size the amplifier for the driver.
For the tweeter however this test is showing one of its limitations and a scope really is required. In this case it is more informative to play a wide variety of music through the system, at the max volume, with a scope hooked up and see how high the peaks reach. Don't get me wrong however, using the test at 20khz would have given me an absolute 'worst case' requirement for the tweeter amplifier and would be the 'safest' bet, but it would also oversize it for the vast majority of music.
Below you will see the transfer function/gain of the individual networks within the main three way part of the loudspeaker.
As can be seen the gain varies by a huge amount vs frequency over the bandwidths that the drivers are asked to reproduce and as a result the voltage the amplifiers will be asked to reproduce vs 0dBfs will also change considerably depending on the frequency. So what do you do?
First lets look at the midrange driver (net gain 2) as this is the easiest one to make this work for. It can be seen that the point of maximum gain for the midrange is at around 750hz. This is useful because music easily has the potential to contain a lot of energy at this frequency. As a result it would make sense to run this test for the midrange driver at 750hz and it would give accurate results.
Next lets look at the tweeter (net gain 1). Here we've got a huge problem. As you can see the gain goes up as frequency increases (and by a large amount too), but at the same time we know that on the whole music contains less and less energy the further up in frequency you go. If I wanted to play this on the safe side I could measure at 20khz, but by doing this I would probably oversize my amplifier requirements considerably. If I did the measurement at 10khz for example I would need an amplifier with half the voltage swing then if I had done the test at 20khz.
It's similar for the bass driver too, here there's a LT circuit in place that adds a peak of gain at 35hz. But once again most music doesn't have a lot of content down that low, but then again some will. Here I am saved by the laws of physics though because in its specific cabinet that driver runs into xmax with around 28Vrms, which is what the amplifier can provide, so in that sense it's an easy enough task to size the amplifier for the driver.
For the tweeter however this test is showing one of its limitations and a scope really is required. In this case it is more informative to play a wide variety of music through the system, at the max volume, with a scope hooked up and see how high the peaks reach. Don't get me wrong however, using the test at 20khz would have given me an absolute 'worst case' requirement for the tweeter amplifier and would be the 'safest' bet, but it would also oversize it for the vast majority of music.
Attachments
Hi Tom,
I'm sorry if you feel like you haven't been getting thru, but it's been just as frustrating from this side.
You seem to be reading into this test things that aren't there. You are not alone. This isn't a set up or optimization test, or a loudspeaker performance calculation, it's just a voltage measurement under normal operating conditions. Let me see if I can explain better
I did suggest listening to a few tracks to get an idea of were your maximum level is.
I'm sorry if you feel like you haven't been getting thru, but it's been just as frustrating from this side.
You seem to be reading into this test things that aren't there. You are not alone. This isn't a set up or optimization test, or a loudspeaker performance calculation, it's just a voltage measurement under normal operating conditions. Let me see if I can explain better
And you did. But the test is not set up like that. The sine wave test tones that I provided in no way set any level. None. They bare no direct relation to any average levels.I tried to explain why the sine test has a tenuous connection to what is required for some kinds of program material but fine for others.
That is certainly not the issue in this test. Never was. Nowhere is "required" mentioned. It is simply a measurement of the voltage going to your speakers. In this case, the voltage going to your speakers when playing loud. That's all.The issue was supposed to be what is required to drive the speakers, that includes what is hard for them, not just compressed music or tones ..
Yes, and it's an important point. The spectral content of the music can make you turn it up or down, even with pieces played at the same SPL. Bass heavy music is a good example, as we tend to tolerate that much louder.I tried to explain that one’s impression of loudness is not necessarily an indicator of producing all the signal or strongly tied to what one measures while what one measures IS what the system is doing.
I did suggest listening to a few tracks to get an idea of were your maximum level is.
That is precisely why I picked a 120Hz sine wave for the test signal. To quote myself in post two.I tried to explain (since some folks are tempted to try to measure ) that the meters people are likely to used if they don’t have real test equipment HAVE a frequency response which may or may not allow them to be accurate other than around 60Hz or with changing signals.
Pano said:We use a sine wave to test with (after setting the level) because it's easy for a voltmeter to measure accurately, unlike music. All the meters I've tested have been accurate at 120Hz and within a small fraction at 220Hz.
Yes it is. But if you understand digital recordings and this test, you will understand that it is not needed for this test. The tone you measure will be precisely 12dB below the highest peaks. With a digital source, it can be no other way. Period. Once you understand this, then you understand the test.I have suggested that in order to tell if one has enough power, that the BEST TEST is one examining the actual Voltage signal going to the speakers at a level your happy with, with the program material you like to listen to and look for signs of limiting with an oscilloscope.
Again, it is not a bad idea and no one here has ever said that it was. We've been over this before.Honestly, I don’ see why this is a bad idea here, this kind of test has revealed many problems in larger sound systems too where gain structure (not just amp limits) can be an issue too..
All fine and dandy, but of no real use in this test. See above. It's not a set up test - it's a test of what voltages you are actually using.In a effort to illustrate that the peak electrical power or Voltage required and the apparent loudness ARE NOT strongly tied, I suggested two kinds of artificial test signals which would clearly illustrate that, in the case of the pink noise signals with various music like peak to average ratios, these if played back at the same apparent loudness, requires as much as tens thousands of times more peak power to be the same subjective loudness.
You are still stuck on this and it does not apply to this test.A sine wave, requires even less peak power for a given apparent loudness than the 6dB crest pink noise and that more compressed than any music one can find.
This is because you are reading something into the test that is not there. You are coming from a design point. This is NOT a design exercise. It is simply a test of amplifier output voltage under (near) normal conditions. Please don't take it for anything else or read into it what is not there.All this may seems like an excessive focus on the dynamics of the signal but that’s what I wish to preserve /reproduce.
While it was a mistake to contribute to this thread, I am not asking people to believe what I am suggesting, just to look using tools that will show the engineering reality at the root of this.
I was thinking about something. not sure it will catch but...
maybe we should select one "worst case song" (classical with a large peak-to-average ratio and headroom) and have people do the test with it. that way, after the test is performed as Pano described it, knowing the SPL and impedance of the speakers, the required power and listening distance we can get a rough estimate of the SPL. the song can be analyzed in CoolEdit to get mean/peak power and SPL can be derived from there.
one problem I'm seeing is a song selection that would not get anyone into legal issues.
other is testing with music that might not appeal to everyone. some might turn it down if they dislike it

you multiply by two? LOLHow go you get 1.47 Watts from 0.72V
I thought about adding a test track too, something classical and very dynamic, the trouble is the copyright involved. I've got a high res 24/176.4 recording of Tchaikovsky's Hopak that was free to download from some website ages ago, I'm guessing that that would be okay? It's not too long and has some very large peaks relative to the quiet start and is rather fun to listen to.
I have converted it down to 44.1k 16bit and compressed it to a reasonably high quality FLAC and here's a download link. I also altered the level slightly so that the peak signal level of it hits 0dBfs too. How long the download will exist for I don't know
Tchaikovsky Hopak.flac
Pano may wish to download it and convert it perhaps into something different.
Last edited:
did a listen on my headphones (Senn HD448) and it sounds like a good choice.
here's what CoolEdit says:
Left Right
Min Sample Value: -31858 -29823
Max Sample Value: 30453 32178
Peak Amplitude: -.24 dB -.16 dB
Possibly Clipped: 0 0
DC Offset: 0 0
Minimum RMS Power: -63.46 dB -66.44 dB
Maximum RMS Power: -4.21 dB -5.49 dB
Average RMS Power: -22 dB -22.17 dB
Total RMS Power: -19.25 dB -19.5 dB
Actual Bit Depth: 16 Bits 16 Bits
Using RMS Window of 50 ms
exactly 18dB peak-to-average, isn't that nice. no clipped samples, some headroom, should do the job.
- Home
- Loudspeakers
- Multi-Way
- A Test. How much Voltage (power) do your speakers need?