Hi fifth
I guess the point I was trying to make was that there is a HUGE variation in what the recorded material demands.
Also, the confusion about subjective loudness and the requirements of reproducing a signal or event.
IF one knew how much power or Voltage it took to make ones stereo sound as loud as one would choose, one has a figure that applies only to that particular program material / circumstances.
What is not known in such a test is how much dynamic compression are the speakers adding?
From heating alone, loudspeakers usually begin to exhibit power related nonlinearity between 1/8 and 1/10 rated power and if the driver hasn’t failed, the driver may even reach the point where doubling the input power causes the output to go down.
For today’s recordings made under the loudness war era, one needs little more power than that as the largest peaks may only be 4 to 10 times the average level which we interpret as loudness.
The reason for the loudness wars is clear here;
As digital zero is the largest thing one can store as a signal, then what one can say is that the maximum subjective loudness one can attain is anywhere from -6 to -30dB down from that, about -40 dB for goofy recordings like my fireworks.
Thus, to reproduce those things at the same subjective loudness also requires a vast span so far as the powers required. Alternately, if you want the CD to be “loud” you have to raise up all of the low level stuff 20-30-40dB so that the average level is as high as possible.
Here, we had a similar thing with TV commercials, the maximum level is set by the FCC but if you compress everything to the max, the commercial sounds a lot louder, in fact is a lot louder and still lives within the limits.
Since what we hear as “loudness” is strongly affected by duration, by frequency range by the bandwidth of the signal so like tying THD to what it sounds like is troubled alignment.
I would urge anyone curious to down load that VU meter (orban is in the recording area) and look at the music you play.
If its esoteric recordings or older recordings, ones made before the loudness wars, you may find some real dynamic range.
If you own an oscilloscope, the ONLY WAY TO KNOW if you have instantaneous clipping, is to actually examine the signal going to your speaker.
Lastly, a huge problem is tying what one sees in a measurement to what one hears. We have used an old technique at work which while it doesn’t provide a measured result, you sure as heck can hear what’s wrong.
I feel this has been a valuable step both for keeping track of our progress but also to see where our competitors are.
Take a good measurement mic and the speaker in question and hoist them up on a tower so that there are no close reflections. With a 24/96 multi-track recorder, play a difficult music track through the speaker at say 80-90 dB and record the mic signal as well as the audio track.
Play the mic signal through th speaker and record the new mic signal and music track.
In the old days, this was called a generation loss test, the idea being a perfect thing inserted in the loop will allow an infinite number of generations.
I am not aware on anyone doing this with loudspeakers but it seemed like a good idea when we started the company. Whatever warts a speaker has, where ever it is not perfect, they become exaggerated with each generation. Some speakers that radiate an interference pattern sound pretty lame on just one pass (no generations just capture) and sound different when you move the microphone, the best start to sound sick at three generations.
Loudspeakers are far from perfect and the reality check one can do at the same time is to do the same generation loss test with the direct musical track.
The shop had a demo last month where an attendee made a video with something that looked like an i-phone or something, made a nice video though.
At about 1:30 or so the operator walks up to the person next to the camera man and speaks, adjust the headphone volume to scale that voice. At about 2:30 he pans out to the field where most of the people were standing (these would be for hifi in a stadium etc)
Danley Sound Labs - YouTube
Best,
Major Iceborg (click click)
Think I am going to watch that tonight.
A level Anomaly... can anyone explain please
Can anyone offer an explanation for this.
Two players. A Micromega (TDA1035 DAC) and a Philips CD150 (TDA1540 DAC's).
Two manufacturers test discs. A Philips and a Denon. Both have test tones at 0db.
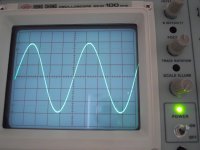
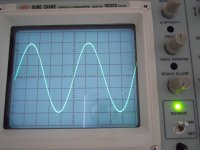
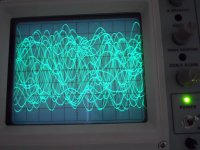
I play the 0db test tones and measure 6 volts peak to peak give or take a few millivolts at the line output of each player. The scope trace was also absolutely centered correctly.
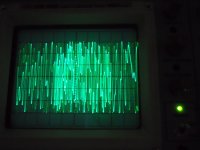
I then played the 0db track of white noise.
The Micromega peaks at exactly 6 volts pk/pk the same as the 0db sine wave.
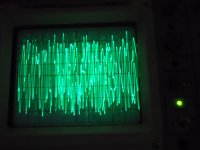
The Philips "plays" it differently. Peak to peak I estimate as around 7.4 volts.
I also mentioned the scope trace being centered... the Micromega is "symetrical" above and below the zero point when averaged by eye (and in the pic) but the Philips takes on a "shift" in the positive peaks seem predominant.
The last shot shows the Philips playing white noise, this time with the trace deliberately offset a fraction to help me gauge the amplitude.
Any thoughts on this one")
Can anyone offer an explanation for this.
Two players. A Micromega (TDA1035 DAC) and a Philips CD150 (TDA1540 DAC's).
Two manufacturers test discs. A Philips and a Denon. Both have test tones at 0db.
I play the 0db test tones and measure 6 volts peak to peak give or take a few millivolts at the line output of each player. The scope trace was also absolutely centered correctly.
I then played the 0db track of white noise.
The Micromega peaks at exactly 6 volts pk/pk the same as the 0db sine wave.
The Philips "plays" it differently. Peak to peak I estimate as around 7.4 volts.
I also mentioned the scope trace being centered... the Micromega is "symetrical" above and below the zero point when averaged by eye (and in the pic) but the Philips takes on a "shift" in the positive peaks seem predominant.
The last shot shows the Philips playing white noise, this time with the trace deliberately offset a fraction to help me gauge the amplitude.
Any thoughts on this one
Attachments
Hi Mooly
Try this same test but lower the level say 6dB more. See if the difference is still present or are they both the same then.
Transfer the file to a computer and open it with some thing like Cool edit that can analyze the data in the digital form or try the orban VU meter and see what it says.
Not sure about white noise, the kind used for testing in RF had more like a 10dB peak to average ratio. If any of your circuitry were limiting, you may see a different peak to average ratio when the average level is lowered.
Try this same test but lower the level say 6dB more. See if the difference is still present or are they both the same then.
The Philips disc has a -12 db white noise track but when I tried that yesterday that too gives over the expected level... and that was on yet another player. I didn't try the Micromega though... tomorrow maybe
There the only these two white noise tracks
http://www.diyaudio.com/forums/mult...ower-do-your-speakers-need-7.html#post2881498
Shot 2 in the above link is the Denon 0db track. The last shot is the Philips -12 db one.
Not sure about white noise, the kind used for testing in RF had more like a 10dB peak to average ratio. If any of your circuitry were limiting, you may see a different peak to average ratio when the average level is lowered.
There does look to be quite a difference in peak to average between these two actually. The Denon track is much more uniform.
Although that doesn't explain the 0db absolute maximum apparently being violated.
As I alluded in my previous post I thought it was phase related.
I did some quick comparisons between unfiltered white noise and one with a steep -15dB PEQ cut at 20kHz with a bandwidth of 0.110 oct. simulating a brick wall filter.
The peaks does become a lot higher with the PEQ in place.
Same when using Hilbert transform.
White noise has such a lot narrow spikes and high energy at high frequency so a phase shift causes them to stack on top of each other providing a greater signal amplitude then an unfiltered signal.
Very simple to play around with in Audacity.
Mooly it is entirely possible that the extra you're seeing could be high frequency hash as produced by the DAC. Granted that's a lot of ultrasonic noise but it has to come from somewhere.
Dan you continue to make me laugh
I do once again however feel that your post is slightly missing the point again, or maybe it's just that you're not happy with the way things are being discussed in this thread.
Lets say one takes a digital sine-wave signal of 0dB and plays it through their system. They then advance the volume knob to the maximum position that they ever play music at. Now they record the voltage this signal produces on the output of their amplifier and compare it against the voltage rails within the amplifier (or calculate and compare vs the 8 ohm watt spec). Providing the voltage is a few volts, say 5 to be on the safe side, below the output stage rail voltages and the amplifier over current protection isn't triggered, then you can be safe knowing that you're not going to clip your amplifier.
Yes the easy way to do this is to use a scope, but it's not necessary unless your speakers are known to be buggers to drive.
There is nothing more to it then that.
It is physically impossible (Mooly's odd test results notwithstanding) to send a signal greater then 0dB through the system. So if you never move the volume higher then the position you did the above test at, then it is physically impossible for the output of the amplifier to clip due to voltage limitations as you've already proven that a 0dB signal wont clip your amplifier.
Of course we can argue all day about what we perceive loud to be, or whether or not you're going to end up increasing the volume because your loudspeakers voice coils have heated up and the output has gone done. But that's not what this is about. This is about people, in their own homes, with their own music, on their own systems setting the volume control to one specific position and running a test. They judge this position based off of their own perception of what loud is with music that they listen to. Of course it's flawed in general terms, but it is nontheless useful to that individual and interesting from the point of view of this thread. Regardless of if people are out by 10-20% it is clear to see that most people don't require hugely powerful amplifiers.
Major Iceborg (click click)
Dan you continue to make me laugh
I do once again however feel that your post is slightly missing the point again, or maybe it's just that you're not happy with the way things are being discussed in this thread.
Lets say one takes a digital sine-wave signal of 0dB and plays it through their system. They then advance the volume knob to the maximum position that they ever play music at. Now they record the voltage this signal produces on the output of their amplifier and compare it against the voltage rails within the amplifier (or calculate and compare vs the 8 ohm watt spec). Providing the voltage is a few volts, say 5 to be on the safe side, below the output stage rail voltages and the amplifier over current protection isn't triggered, then you can be safe knowing that you're not going to clip your amplifier.
Yes the easy way to do this is to use a scope, but it's not necessary unless your speakers are known to be buggers to drive.
There is nothing more to it then that.
It is physically impossible (Mooly's odd test results notwithstanding) to send a signal greater then 0dB through the system. So if you never move the volume higher then the position you did the above test at, then it is physically impossible for the output of the amplifier to clip due to voltage limitations as you've already proven that a 0dB signal wont clip your amplifier.
Of course we can argue all day about what we perceive loud to be, or whether or not you're going to end up increasing the volume because your loudspeakers voice coils have heated up and the output has gone done. But that's not what this is about. This is about people, in their own homes, with their own music, on their own systems setting the volume control to one specific position and running a test. They judge this position based off of their own perception of what loud is with music that they listen to. Of course it's flawed in general terms, but it is nontheless useful to that individual and interesting from the point of view of this thread. Regardless of if people are out by 10-20% it is clear to see that most people don't require hugely powerful amplifiers.
Hi 5th
I guess my issue is that the title sounded like the issue was to determine if one has enough power playing music and not calibrating ones volume knob position.
The problem is, that using a sine or anything other than the signal in question, gives you a result applicable to only that case.
The issue is that while a sine requires a minimum of “headroom” music has a huge variability, some requires little some a lot. The people who do take up the suggestion to look, often enough find it is the case.
Since the concern for many is the “loudness” and what I am talking about is dynamic range, it is something like old subwoofer discussions where loudness and extension are hopelessly confused.
I have also suggested people examine their music to see what it actually contains and provided a link to a free tool so I am not sure what else there is to say other than look into it.
The problem is that for a given apparent loudness, the peak power required depends on the program material and is not a set ratio. How much of the signal do you want to reproduce?
If that is a concern, first examine the signal to know what you’re dealing with and then what goes to the speakers.
Tom Danley
Danley Sound Labs
Yes Tom, but the point here is that peak power and apparent loudness don't come into it. The sine wave replayed at 0dB is the absolute maximum, by definition, that the system will be called on to reproduce. If you set your volume control such that the amplifier isn't clipping when a 0dB sine wave is being played, then no matter what music, or type of signal you feed the system afterwards, the amplifier will then never clip due to voltage limitations.
One sets the volume control based off of what they consider to be loud with their chosen piece of music. They then play a 0dB tone through the system as this represents the absolute maximum that any transient played at that volume setting could reach. If the amplifier isn't clipping, or the measured output voltage falls within the output spec of the amplifier, then no matter what music they then play, providing they don't advance the volume knob, the amplifier wont clip.
The music only matters here where its important, when one sets the initial volume from the actual listening process. I think it's obvious that if you listen to compressed pop that your average to peak ratio will be lower and the apparent loudness greater. Hence someone who listens to pop will set the volume control lower then someone who listens solely to dynamic classical works. But then again that might not be true, there will be a few people who will listen to pop at very loud levels and then some people (like my mother) who'd listen to classical at a low volume and certainly not anywhere near loud enough to hear it as the composer intended. This is the point of the thread though, to get an idea for what the individuals power requirements actually are.
Yes, I could look at a VU meter, or analyse my music using audacity, where I'd notice that the average level for my classical stuff is 15dB lower then my pop stuff. I'd also notice that the pop stuff sits at 0dB a lot of the time and the classical only ever reaches -1dB a couple of times. Naturally I'd set the volume control ~15dB higher for the classical then the pop and I'd need 14dB more headroom for the classical transients vs the pop, but I can arrive at this figure too by listening to the music and seeing where I set the volume control. Then of course the level I want the system at will differ from the next person and we actually need to listen to find that out.
Hello from Miami Beach!
Nice to see the good discussions. Mooly, your findings are interesting, and certainly merit a close look. I'll do some tests of my own when I get the chance. I do wonder if it's a phase problem at the top of the band. Maybe LP filter on the file could tell us.
5th E. Thanks for the posts. It does seems that a lot of folks are not getting it. We've both tried, but it's not sinking in yet. Of course choosing the music is important, that's why I've suggested trying a variety of dynamic tracks. If you don't ever listen to dynamic recordings, then no worries.
I've looked at hundreds of music tracks and although there is a nice range of dynamics in many, the loud sections tend to average about -10dBFS. How loud that sounds can depend a lot on spectral content.
So if you want to do the test well, play a good variety of tracks and pick your typical highest volume setting.
I need a 12 watt per channel amp? Hmmm...
To keep out of clipping at the volume level, yes. If you turn it down a bit, you might not clip. You could repeat the test at a more "pleasant" listening level to see if you are clipping there.
A good SET has fairly benign clipping behavior, so you may not hear it or may not mind it if you do. A sort of direct heated compressor, if you will.
Morning all
I feel a bit like this is hijacking Pano's thread a little... if you think another thread on this appropriate
Hi Tom... I'll see what today brings. I've never player around with any audio editing software... we'll see.
I am reading all your posts, however speaker design and measurement etc is something I have no experience off
I looked up the Hilbert transform... the maths is way over my head though I wouldn't like to say one way or the other on this. Whether it is or not though...
-----------------------------------------------------------------------------------------------------------------------
My simple reaction to this was that white noise on CD is still a valid test signal.
(this is opening a whole new can of worms...) When you can start to see differences on a scope between two signals then surely something very audibly different between the two players must be occuring.
Just think about that in a different way. I could swap the opamps in any CD player for 741's and scope the output using say the 1khz squarewave test track and I bet you wouldn't pick out any observable difference between the 741 and whatever audiophile opamp was fitted. That's something I have tried in the past. Is there an audible difference though on music ? We all know the answer to that one.
So what about music with lots of high level hf ? We can't see that on a normal scope, not in such a way that differences could be observed because we can't isolate and view the same music sample over and over and compare easily. Whatever is happening here on the very "dynamic" (as in lots going on) white noise test is revealing massive differences in the way the data is decoded and outputed in analogue form.
------------------------------------------------------------------------------------------------------------------------
That much HF would be a scary thought...
In practice the real world result shows signals considerably over 0db. If there were HF present then that surely has implications for all circuitry handling that signal. We talk of "inaudible" HF interacting with frequencies lower down the band.
That's easy to test at some point
How do you get less than 1 db ?
Hello from Miami Beach!
Nice to see the good discussions. Mooly, your findings are interesting, and certainly merit a close look. I'll do some tests of my own when I get the chance. I do wonder if it's a phase problem at the top of the band. Maybe LP filter on the file could tell us.
I feel a bit like this is hijacking Pano's thread a little... if you think another thread on this appropriate
Hi Mooly
Transfer the file to a computer and open it with some thing like Cool edit that can analyze the data in the digital form or try the orban VU meter and see what it says.
Hi Tom... I'll see what today brings. I've never player around with any audio editing software... we'll see.
I am reading all your posts, however speaker design and measurement etc is something I have no experience off
As I alluded in my previous post I thought it was phase related.
I did some quick comparisons between unfiltered white noise and one with a steep -15dB PEQ cut at 20kHz with a bandwidth of 0.110 oct. simulating a brick wall filter.
The peaks does become a lot higher with the PEQ in place.
Same when using Hilbert transform.
White noise has such a lot narrow spikes and high energy at high frequency so a phase shift causes them to stack on top of each other providing a greater signal amplitude then an unfiltered signal.
Very simple to play around with in Audacity.
I looked up the Hilbert transform... the maths is way over my head though
I wouldn't like to say one way or the other on this. Whether it is or not though...-----------------------------------------------------------------------------------------------------------------------
My simple reaction to this was that white noise on CD is still a valid test signal.
(this is opening a whole new can of worms...) When you can start to see differences on a scope between two signals then surely something very audibly different between the two players must be occuring.
Just think about that in a different way. I could swap the opamps in any CD player for 741's and scope the output using say the 1khz squarewave test track and I bet you wouldn't pick out any observable difference between the 741 and whatever audiophile opamp was fitted. That's something I have tried in the past. Is there an audible difference though on music ? We all know the answer to that one.
So what about music with lots of high level hf ? We can't see that on a normal scope, not in such a way that differences could be observed because we can't isolate and view the same music sample over and over and compare easily. Whatever is happening here on the very "dynamic" (as in lots going on) white noise test is revealing massive differences in the way the data is decoded and outputed in analogue form.
------------------------------------------------------------------------------------------------------------------------
Mooly it is entirely possible that the extra you're seeing could be high frequency hash as produced by the DAC. Granted that's a lot of ultrasonic noise but it has to come from somewhere.
It is physically impossible (Mooly's odd test results notwithstanding) to send a signal greater then 0dB through the system. So if you never move the volume higher then the position you did the above test at, then it is physically impossible for the output of the amplifier to clip due to voltage limitations as you've already proven that a 0dB signal wont clip your amplifier.
That much HF would be a scary thought...
In practice the real world result shows signals considerably over 0db. If there were HF present then that surely has implications for all circuitry handling that signal. We talk of "inaudible" HF interacting with frequencies lower down the band.
Wait a second, what happens if you play a 20khz signal through them both? A 6>7.4 volt difference = less then 1dB. It's quite possible that one player has a slightly peaky top end.
That's easy to test at some point
How do you get less than 1 db ?
Of course choosing the music is important, that's why I've suggested trying a variety of dynamic tracks. If you don't ever listen to dynamic recordings, then no worries.
I've looked at hundreds of music tracks and although there is a nice range of dynamics in many, the loud sections tend to average about -10dBFS. How loud that sounds can depend a lot on spectral content.
So if you want to do the test well, play a good variety of tracks and pick your typical highest volume setting.
I didn't have time to listen to a variety so I chose one which I knew had quite high dynamic range. Interestingly If I had have gone with my first choice I would have had a higher voltage value. not because the dynamic range was higher, but because that track had lower overall peak (and average) levels.
I downloaded an interesting program called ocenadio (a music editor) which does an analysis of the track and shows peak values and averages. I'm not 100% sure I've interpreted it properly but it seems to give a good indication of the dynamic range of the track. I think it is worth checking tracks to see if they are close to 0db on the peaks, because if you set the absolute loudest level on a track that the peaks are -4db then I think it is going to give an unrealistic high value when the test tone is played
I loaded up a whitestripes track that I really find sounds terrible on my current system and discovered it only had about 4db average to peak difference, which makes me think that is part of the problem.
Tony.
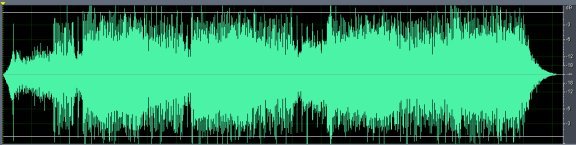
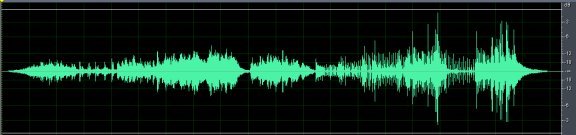
I've made two screenshots in Cooledit Pro of two different tracks with
quite a different dynamic range throughout the songs.
Track number one is 'Private Investigations' by the Dire Straits,
track number two is 'The Unforgiven' by Metallica.
Track number two was taken from a cd purchased in 1991 so i'm
pretty sure this was before Metallica REALLY started to compress the heck
out of their music
If you set your volume-control to 'very loud' during the first half of the first track and don't turn down the volumecontrol in time, you might be in for a nasty surprise going towards the end of the track, if your equipment doesn't have the dynamic capabilities to reproduce the large peaks going towards the end.
If you set your volume-control to 'very loud' after the first snare-drum hit on the second track, you're basically safe throughout the rest of the track.
Attachments
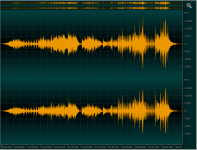
Private investigations was my first choice! But I changed to Telegraph Road, which I had to turn down a couple of times during the track to be comfortable. It was those turned down levels that I used as my final setting! what I noticed was that overall Private Investigations peak levels were not at 0db but Telegraph road's were.
I have to shut down this laptop and plug my main computer back in. the white stripes track has large sections that are just flat across the top
Tony.
But I changed to Telegraph Road, which I had to turn down a couple of times during the track to be comfortable. It was those turned down levels that I used as my final setting! what I noticed was that overall Private Investigations peak levels were not at 0db but Telegraph road's were. I have to shut down this laptop and plug my main computer back in. the white stripes track has large sections that are just flat across the top
Tony.
Hi Back, I've read that Rod Elliot article before it is an interesting and informative one. But I don't think you are getting the concept of the 120Hz sine signal. 120Hz is a nominal value chosen because the average DMM is most accurate around that frequency, and the 12db is chosen for calculation simplicity.... it is not a test about music power, it is a test about what voltage level clipping will occur at.
We are talking about digital reproduction here. The whole concept is based around the fact that you can't have a level higher than 0db from the digital source. You are not going to be able to put a 2V 120Hz sine wave and a 2V 1Khz sine wave superimposed onto your digital medium and get 4V out The limit is still 2V, so regardless of the make up of the waveform it is still going to be max 2V out of the digital source. It is a hard limit
Tony.
We are talking about digital reproduction here. The whole concept is based around the fact that you can't have a level higher than 0db from the digital source. You are not going to be able to put a 2V 120Hz sine wave and a 2V 1Khz sine wave superimposed onto your digital medium and get 4V out
The limit is still 2V, so regardless of the make up of the waveform it is still going to be max 2V out of the digital source. It is a hard limit Tony.
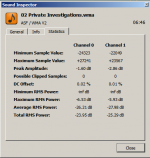
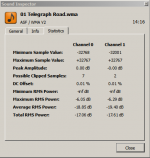
Here is why I chose in the end to use telegraph road for my test, rather than Private Investigations. Note the minimum and maximum sample values and then compare to telegraph road. Fairly obviously private investigations can have the amp volume cranked more (which I usually do!!) than telegraph road because overall levels on the track are lower.
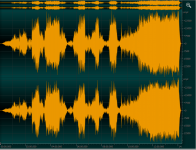
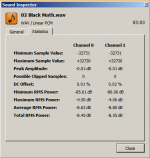
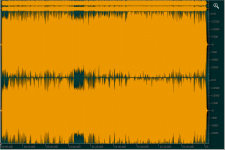
lastly I've upload the analysis and waveform from Black Math of my White Stripes Elephant CD. I'm now less inclined to work out what it is about my system that makes this sound bad. What does interest me is what it is about hearing it in the car on the radio that makes it not sound bad... perhaps I just got a crap CD....
Tony.
Attachments
- Home
- Loudspeakers
- Multi-Way
- A Test. How much Voltage (power) do your speakers need?