OK now I know this is a completely different speaker, but this is to give you an idea of what you are aiming to do with simulation. These are from my Morel MTM consisting of two by MW144's and a DMS37.
Measurements were taken at 1.2M on axis with the tweeter, and zero locked after the tweeter measurement to ensure that the phase information remained the same for the two drivers (ie it takes into account their relative offets).
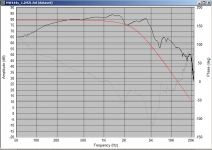
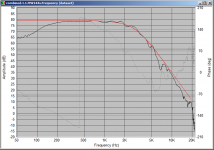
The first picture is the MW144's raw measurement the red-line is the target acoustic response, which is a 4th order bessel at 2.8Khz. I opted to go for pretty much full Baffle step compensation as these speakers will ultimately be mated to stereo subs at a crossover frequency of around 300Hz.
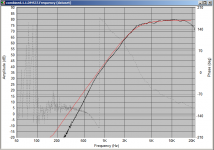
The second pic is the DMS37 raw response with the target 4th order bessel at 2.8Khz in red.
The Mw144's curve as you can see presents some problems when trying to get it to match the target response, a traditional fiter just wasn't going to get it done, so I first did some notches to get it to better conform to an ideal 12db/octave rolloff.
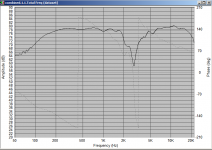
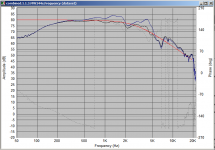
The third picture shows the results of putting two notch filters on the woofers. Note that I'm showing the final notch filters that were optimized in conjunction with the rest of the filter. The red curve in this case is a 12db/octave roll off at 2.8Khz.
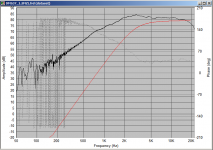
The fourth pic is the tweeter response after the crossover has been applied.
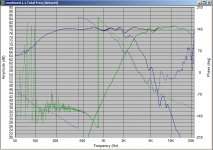
The 5th pic shows the woofer and tweeter response on the same graph, and more importantly their phase response. Note that through the crossover region the phase tracks well. The black curve is the summed response.
the sixth picture shows the response with the tweeter reversed in polarity. the null is at around 2840 Hz, so pretty close to the target.
The 7th picture shows the final measured response of the speaker using the new crossover compared to the simulated response. The blue curve is the real measurement, This was done in a bit of a hurry and not optimally set up, there is something screwy with the phase, but it gives an idea as to the match between the sim and the actual final result.
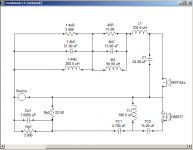
Finally it wouldn't be complete without the actual crossover circuit.
I know that this isn't directly relevant to your project, but hopefully it gives an idea as to how simulation can be used to end up with the final desired result.
Note that I originally had just the notches on the woofer, and a 1st order electrical (ie just a cap) on the tweeter (2nd order bessel at theoretically 3Khz). This I used for around a year, but the phase matching through the crossover region was poor. I was never happy with the sound, and the crossover above is the result of many hours of fiddling doing sims. I built the crossovers based completely on the sims, and I'm very happy with the result, and have not felt the need to tweak further.
Tony.
Measurements were taken at 1.2M on axis with the tweeter, and zero locked after the tweeter measurement to ensure that the phase information remained the same for the two drivers (ie it takes into account their relative offets).
The first picture is the MW144's raw measurement the red-line is the target acoustic response, which is a 4th order bessel at 2.8Khz. I opted to go for pretty much full Baffle step compensation as these speakers will ultimately be mated to stereo subs at a crossover frequency of around 300Hz.
The second pic is the DMS37 raw response with the target 4th order bessel at 2.8Khz in red.
The Mw144's curve as you can see presents some problems when trying to get it to match the target response, a traditional fiter just wasn't going to get it done, so I first did some notches to get it to better conform to an ideal 12db/octave rolloff.
The third picture shows the results of putting two notch filters on the woofers. Note that I'm showing the final notch filters that were optimized in conjunction with the rest of the filter. The red curve in this case is a 12db/octave roll off at 2.8Khz.
The fourth pic is the tweeter response after the crossover has been applied.
The 5th pic shows the woofer and tweeter response on the same graph, and more importantly their phase response. Note that through the crossover region the phase tracks well. The black curve is the summed response.
the sixth picture shows the response with the tweeter reversed in polarity. the null is at around 2840 Hz, so pretty close to the target.
The 7th picture shows the final measured response of the speaker using the new crossover compared to the simulated response. The blue curve is the real measurement, This was done in a bit of a hurry and not optimally set up, there is something screwy with the phase, but it gives an idea as to the match between the sim and the actual final result.
Finally it wouldn't be complete without the actual crossover circuit.
I know that this isn't directly relevant to your project, but hopefully it gives an idea as to how simulation can be used to end up with the final desired result.
Note that I originally had just the notches on the woofer, and a 1st order electrical (ie just a cap) on the tweeter (2nd order bessel at theoretically 3Khz). This I used for around a year, but the phase matching through the crossover region was poor. I was never happy with the sound, and the crossover above is the result of many hours of fiddling doing sims. I built the crossovers based completely on the sims, and I'm very happy with the result, and have not felt the need to tweak further.
Tony.
Attachments
It is where I started with speakers though.
It felt positive for me at the time and set me off on the right foot.
Hi,
For some people how you understood is how they can, that is true.
In another thread a while ago a guy was insisting the OP needed
to make all the mistakes he had over a number of years to reach
"enlightenment", I said your a bit thick, and it is simply not true,
those mistakes are easy to understand if you know the subject.
(Knowing a subject well is being an expert on misunderstanding).
It is up to the OP, who had started the simulation route. IMO if
someone starts it don't stop them. Don't suggest simplifications.
Or if you do say "see how it looks in the simulations".
rgds, sreten.
By the way, where do you get your sensitivity difference of 4dB? (I'm only going off the Madisound pages.)
My bad, going off memory, I should have re looked at the curves... probably closer to 2db if you take the mid at 1000hz and below (ie around 86db) and the woofer (around 88db).
I've assumed that something would probably need to be done about the mid's rising response, and it should be flattened to around the 86db mark.
Tony.
I agree, of course the journey, if we chose to make it, can be satisfying in its own right.In another thread a while ago a guy was insisting the OP needed
to make all the mistakes he had over a number of years to reach
"enlightenment", I said your a bit thick, and it is simply not true,
those mistakes are easy to understand if you know the subject.
(Knowing a subject well is being an expert on misunderstanding).
It is up to the OP, who had started the simulation route. IMO if
someone starts it don't stop them. Don't suggest simplifications.
Or if you do say "see how it looks in the simulations".

After reviewing the facts of the thread and your implications here, this raspberry smilie is the only appropriate response to this.
I've assumed that something would probably need to be done about the mid's rising response, and it should be flattened to around the 86db mark.
I agree. At the highest I'd choose 2,800Hz. An inductor and a series RC in parallel with the woofer may produce a workable slope. If it didn't work well enough I'd look at either increasing the order of the filter or using a notch filter, depending on the needed phase shifts.
The on-axis response is rising at this point but when adjusted in this way, the power will be falling. It is not drastic, except that the baffle mounted tweeter that it will cross to limits the crossover point to be no higher than this.
I did attempt to model, http://www.diyaudio.com/forums/mult...ossover-assistance-request-3.html#post2812710, however my question relating to the frd file and how I couldn't get SPLTrace to work properly after many tries simply turned me away from it thus my apparent interest in the attenuator route. I'm not unwilling to do the modeling I actually quite enjoyed it, however without assistance it seemed to be a moot point. I didn't mean to spark any arguing.
I looked at your file in notepad and opened it in speaker workshop. I can't see an issue but there are some things you should be aware of. Some programs don't like the various FRD files to be different from each other. In other words, settle on a number of points to use across the spectrum and stick to that (somewhere between 256 and 512 should be fine). Also use the same frequency range for all FRD files.
Attachments
Yes. For example choose 20-20,000 and x number of points and always do your files this way when possible. I used to use SPLtrace and I realise that tracing a tweeter from 20Hz with many data points will wear out your finger a bit. If you learn the file format you may be able to do some copy/pasting if you prefer.
All this shouldn't matter but I've had varying degrees of either trouble or inconvenience with different programs so I just do it this way all the time.
All this shouldn't matter but I've had varying degrees of either trouble or inconvenience with different programs so I just do it this way all the time.
I must have missed that you were using speaker workshop, as I was hoping to demonstrate whether your files or your program, or your technique were the issue. Anyway, to combine two graphs (as in put them together in the same graph window), right clilck(on one of them) > add, or for more control, right click > chart properties > data sets.
Initially I was using SPLReader that comes in the SPLTools package. However I can get the tweeter to open in Workshop fine now that I've acquainted myself with the program a touch more. Thanks for the information on combining I was scanning a few tutorials to figure out how but they all had external applications to join the FRDs
Here is the example you asked for.
Here is the example you asked for.
Attachments
Last edited:
You can get the difference between two which is very handy (use the combine > divide function), as is adding two together, shifting them up or down, combining the bass from one and the treble from another into a single curve which is useful too, or turning them upside down.
You can create a target curve including any desired tilting, boosting or shelving for your final result, and then apply that against the target curves for the drivers which start out as a text book rolloff at the crossover.
You can take a shot of your equaliser and combine that with the simmed total response, then reinvent your crossover to meet that curve, then reset your EQ to flat. etc.
As it turns out it worked just fine. I attached a copy of the Speaker Workshop file as I have it on my computer. I am hoping to start modifying the files to work at my target curve and bring things together. Thanks again to everyone who is being so helpful I'm glad nice people are out there willing to help those less informed.
Attachments
The only concern I have had with SW and FRD files that are different, is the default scaling which isn't technically a problem. Otherwise I would have loaded the chart into SPLtrace, indicated where 200Hz is and that I wanted to go from 20, and entered some insignificantly low value for the lower frequencies.
Have you learned about producing four networks in SW for a three-way design?
Have you learned about producing four networks in SW for a three-way design?
If you create a network with your entire crossover, there will be files that end up being associated with it, ie: the target curve you create, the total response, the individual driver response charts and an impedance one, if you specified it.
You can create directories (folders) to put your files in and you should probably create one for all the above files, create more to hold all your woofer stuff, mid and tweeter files, and then for the woofer crossover, mid and tweeter crossover separately.
The issue here is that you get one goal per network. The goal for your separate drivers will be different to your overall goal. As you optimise each driver, copy/paste that network into the main combined network.
To use a goal, right click on the response chart that is produced when you analyse the network, and add the goal chart.
Another thing you may find appropriate is that once you have an FRD file in speaker workshop you can modify its frequency limits and the number of points it uses. Right click on the chart and choose properties (not chart properties which happens to be the more often used of the two).
I usually standardise in this way for two reasons, either because the default uses some ridiculously high number of points that makes calculation time longer than necessary, and when exporting a file, which I do when I want to take a 'bookmark' and preserve a curve, or to work on a curve that is either too critical to change without making a copy, or which is a temporary kind, such as a network response curve.
Beware that if the resolution is not there to begin with, it's obviously like zooming in on a picture with insufficient resolution. I also wouldn't modify the most fundamental measured curves but rather I'd create those ones right to start with.
- Status
- This old topic is closed. If you want to reopen this topic, contact a moderator using the "Report Post" button.
- Home
- Loudspeakers
- Multi-Way
- 3-Way Crossover Assistance Request.