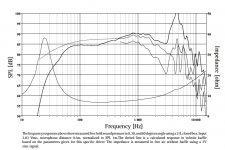
The four new Discovery woofers at Scan-Speak's site all have ugly response below 100Hz on their FR curves. Is this a "measurement anomaly," and is it even physically possible to have such extreme variations over such a small bass frequency range?
Actually, even the larger Revelator woofers are just as ragged, so what's going on?
Actually, even the larger Revelator woofers are just as ragged, so what's going on?
Attachments

The data sheets from SS say blah, blah..."it results in very low distortion and a smooth and well behaved frequency response..."
I understand the cone break-up up in the mids, but BELOW 100Hz? FR in datasheets for older SS woofers are much smoother, so have they changed their test method?
I understand the cone break-up up in the mids, but BELOW 100Hz? FR in datasheets for older SS woofers are much smoother, so have they changed their test method?
Last edited:
Indeed Zaph's FR curve for the Scan-Speak 22W/8851T00 looks nothing like Scan-Speak's own curve, so I suppose the smoothing (and other parameters?) is not the same. Now I wonder why SS would want to publicize such relatively ragged curves if it's not a real part of the woofer's response...
")
its quite possible that Scan-Speak measurement has lot less smooting done in comparison to Zaph's measurement, otherwise they do look similar
I have seen similar bumpy response on numerous woofers, I do not think its an artifact. You have to consider Y scale too. Some publish data (like TangBang) practically from 0 dB to 100 dB range for the graph to look better.
I have seen similar bumpy response on numerous woofers, I do not think its an artifact. You have to consider Y scale too. Some publish data (like TangBang) practically from 0 dB to 100 dB range for the graph to look better.
The magnitude of those peaks/dips isn't a big problem until below 70Hz, although they appear at around 100Hz. They look like the result of measurement in an anechoic chamber, maybe one designed to be most effective down to around 100Hz. The high Q of the upper range breakup indicates that they're not using any smoothing.Indeed Zaph's FR curve for the Scan-Speak 22W/8851T00 looks nothing like Scan-Speak's own curve, so I suppose the smoothing (and other parameters?) is not the same. Now I wonder why SS would want to publicize such relatively ragged curves if it's not a real part of the woofer's response...
The reason why zaph's curves look better is due to his need to splice a close-mic measurement to a quasi-anechoic measurement due to the limited reflection-free time available for the window of the impulse. His splice is somewhere around 300-500Hz I think, I forget if he provides that detail.
Publicizing these curves isn't an issue for those familiar with the conditions. I'm sure that most of their major customers understand that the response is due to these conditions.
Interesting reading from Meyer Sound here.
Dave
Last edited:
If these are anything like their higher priced lines it will sound phenomenal.
The best speakers I ever heard was a DIY scan speak 3-way, in fact two completely diffirent implimentations built by two friends who did a bulk order. I couldn't choose between them, they were both that good. Especialy the bass, dry and smooth.
The best speakers I ever heard was a DIY scan speak 3-way, in fact two completely diffirent implimentations built by two friends who did a bulk order. I couldn't choose between them, they were both that good. Especialy the bass, dry and smooth.
Finally a manufacturer publish real and unsmoothed frequency response graphs, and then that's a bad thing?
I give supreme respect to Scan-Speak have the guts to do what no other speaker manufacturer dares.
SEAS have been doing this for years, as have vifa/speak/peerless. And if they have ever used smoothing it has only been a very small amount.
I agree that the Revelator woofers I heard made some of the best bass I've ever heard, although I had not examined an FR curve for them until now.
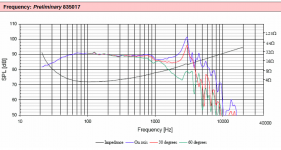
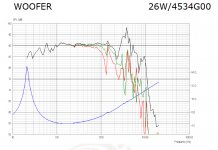
Here's shown the FR for a Scan-Speak Discovery 30W/4558T00 subwoofer, which looks very desirable in the bass (first pic):
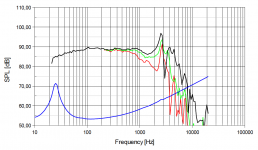
The second pic is of a Seas Excel W22EX001 E0022, which appears smoothed.
And the third pic is of a Peerless XXLS 835017, which looks nice without any apparent smoothing.
Here's shown the FR for a Scan-Speak Discovery 30W/4558T00 subwoofer, which looks very desirable in the bass (first pic):
The second pic is of a Seas Excel W22EX001 E0022, which appears smoothed.
And the third pic is of a Peerless XXLS 835017, which looks nice without any apparent smoothing.
Attachments

So the Scan-Speak Discovery woofer is ugly, but the SS Discovery subwoofer is nice? Same company, same series (Discovery aluminum cone), same test? Something's not right....
Don't forget the DB scale, you've got one that jumps in 10db increments and the other is 5, it's going to look jumpier naturally.
You seriously don't see past that?Don't forget the DB scale, you've got one that jumps in 10db increments and the other is 5, it's going to look jumpier naturally.
You seriously don't see past that?
I think I do? I'm not sure precisely what you mean by that, but I was merely aiming to point out that even though one of those charts looks markedly worse than the other, it's only worse by 1 or 2 db.
One has almost 5dB of change within 10Hz in two places below 100Hz (and 4dB in three other places); the other one has barely 1dB wiggles anywhere below 100Hz....
It is those sharp 4-5dB up-down changes that makes me question whether a woofer can physically respond like that.
It is those sharp 4-5dB up-down changes that makes me question whether a woofer can physically respond like that.
Last edited:
One has almost 5dB of change within 10Hz in two places below 100Hz (and 4dB in three other places); the other one has barely 1dB wiggles anywhere below 100Hz....
It is those sharp 4-5dB up-down changes that makes me question whether a woofer can physically respond like that.
I think the answer to your question must come from Scanspeak. Have you written to them and asked exactly how they test woofers and what level of smoothing they used in the published tests?
I really wouldn't worry about it. The SEAS graphs are obviously composites and any near-field measurement technique will give ruler flat/smooth responses in the bass.
Whenever you start introducing the room into the equation, peaks and dips like that can and will show up. Take a look at the 8 ohm version of that driver, the 8534. Even though the drivers are identical, except for the voice coil, the top end response of each is different. However the bass response is identical, one would assume that they had been measured at the same time too.
Now take a look at the revelator/classic/illuminator drivers under the 'woofer' section, they all show peak dip combos at roughly the same frequencies in the bass. It is obviously a measurement artefact.
Drivers typically display ruler flat frequency responses when they are operating within the cones pistonic range (at low frequencies). The only thing that would cause bumps/kinks would be a resonance of some sort and if severe enough they would also show up in the impedance plot.
- Status
- This old topic is closed. If you want to reopen this topic, contact a moderator using the "Report Post" button.
- Home
- Loudspeakers
- Multi-Way
- Scan-Speak Discovery woofers ragged FR below 100Hz?