Today I did some measurements on the B&G Neo3W and Neo3PDR. Biggest differences:
- Neo3W has approximately 3 dB higher sensitivity
- Neo3PDR has better dispersion in the top octave
- Neo3W has a smoother transition from dipole to beaming
EDIT: too bad, the pdf is too big to upload. Try this link: [removed link]
I hope it works.
EDIT2: apparently not too well. I'll have to try something else.
EDIT3: I've got a zip uploaded, but without the pictures.
EDIT4:
http://img843.imageshack.us/img843/6442/measurementsetup.jpg
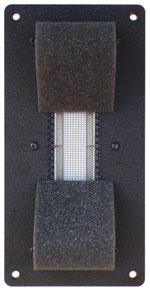
http://img651.imageshack.us/img651/5986/photoofbothtweeters.jpg
- Neo3W has approximately 3 dB higher sensitivity
- Neo3PDR has better dispersion in the top octave
- Neo3W has a smoother transition from dipole to beaming
EDIT: too bad, the pdf is too big to upload. Try this link: [removed link]
I hope it works.
EDIT2: apparently not too well. I'll have to try something else.
EDIT3: I've got a zip uploaded, but without the pictures.
EDIT4:
An externally hosted image should be here but it was not working when we last tested it.
An externally hosted image should be here but it was not working when we last tested it.
http://img843.imageshack.us/img843/6442/measurementsetup.jpg
http://img651.imageshack.us/img651/5986/photoofbothtweeters.jpg
Attachments
Last edited:
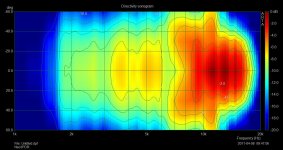
The sonograms are derived from the same data as the frequency response curves: 0, 15, 30, 45 and 60 degrees. I omitted the data at greater angles, as the exact setting of the angles becomes very critical if you want to be able to accurately compare the drivers.
BTW, I've been using the Neo3W up till now, but I think I'll give the PDR's a second chance.
BTW, I've been using the Neo3W up till now, but I think I'll give the PDR's a second chance.
Keyser, this is a very informative comparison!
From your 3rd picture in the pdf I see a difference of 5 dB at quite some places. Since the PDR has foam added behind half of the openings, they appear to be almost blocked (total blocking would result in 6 dB difference imho). I would have hoped for a less radical solution by BG.
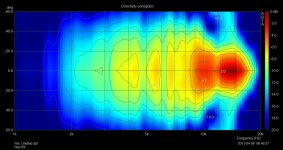
In consequence the active driver width (source) has been halved, while the baffle width has stayed the same. The differencies between the polars very nicely document the difference between a wide source and a smaller source on the same baffle:
-the baffle width dictates the position of the dipole notch (6 kHz in this case)
-the smaller source will start to beam later than the wide one - regardless of baffle size.
- this opens the "blooming" region between the dipole notch and the onset of beaming. Polars of the ORION for instance show the "excessive" (compared to the Neo3) width of that region clearly.
As desribed above: By widening the baffle you draw the dipole notch to lower frequencies. You get the same width of the "blooming" region as with the PDR, with everything starting at lower frequencies only.
The most elegant (I would say "best") solution would be to have the widest source in the narrowest baffle.
Rudolf
From your 3rd picture in the pdf I see a difference of 5 dB at quite some places. Since the PDR has foam added behind half of the openings, they appear to be almost blocked (total blocking would result in 6 dB difference imho). I would have hoped for a less radical solution by BG.
In consequence the active driver width (source) has been halved, while the baffle width has stayed the same. The differencies between the polars very nicely document the difference between a wide source and a smaller source on the same baffle:
-the baffle width dictates the position of the dipole notch (6 kHz in this case)
-the smaller source will start to beam later than the wide one - regardless of baffle size.
- this opens the "blooming" region between the dipole notch and the onset of beaming. Polars of the ORION for instance show the "excessive" (compared to the Neo3) width of that region clearly.
You can try adding some foam/felt/etc on the outside of the Neo3W to create a narrow source for high frequencies, similar to the Neo3PDR. You might be able to reduce the beaming in the top octave while avoding the bloom at 7.5 kHz.
As desribed above: By widening the baffle you draw the dipole notch to lower frequencies. You get the same width of the "blooming" region as with the PDR, with everything starting at lower frequencies only.
The most elegant (I would say "best") solution would be to have the widest source in the narrowest baffle.
Rudolf
Now I too own a pair of PDRs as well as regular Neo3's. I'll try and run equivalent comparisons like this some day. Subjectively, I prefer the sound of the PDRs, even though the measurements show a deeper notch. My theory is that the wider upper treble dispersion somehow works better in my room.
I think they're referenced to 0, so the 'bloom' you see at 7kHz is really the on-axis dip affecting the data normalization. I think. Keyser, if you have the data saved, could you plot the same charts, un-normalized? I find it useful to look at it both ways.Quite the bloom on the PDR. The sonograms are derived from the 15 degree data?
Regardless of how the data's displayed the finding's still the same; more bloom on the PDRW than the W.
For nude and near-nude drivers such as in this study, yes. Horns represent the opposite end of the design continuum and appear to be viable too---it's mainly midway between the extremes where performance gets dicey. Certainly easier to mill down the flange on the Neo3 than to build a horn (or waveguide), though the desirability of doing so depends on how low the Neo3 needs to cross.The most elegant (I would say "best") solution would be to have the widest source in the narrowest baffle.
I would disagreeRegardless of how the data's displayed the finding's still the same; more bloom on the PDRW than the W.
You could have two drivers with identical off-axis curves, and one of them has a deeper notch on-axis. The normalized curves would show this same difference. Would you describe that as one driver blooming more than the other? I wouldn't. I guess technically you would be correct, but that's not what I think about when I think 'bloom'.As desribed above: By widening the baffle you draw the dipole notch to lower frequencies. You get the same width of the "blooming" region as with the PDR, with everything starting at lower frequencies only.
The most elegant (I would say "best") solution would be to have the widest source in the narrowest baffle.
Rudolf
Agreed, but there is the possibility to vary the thickness of the foam/felt from the center to edge, like RAAL does on their tweeters:
(RAAL Ribbon Tweeters).
For the Neo3W this would obviously be left to right instead of top to bottom.
Another possibility would be small foam/felt wedges, similar to what Audiostatic does with their electrostatic loudspeakers:
An externally hosted image should be here but it was not working when we last tested it.
The sonograms without normalization aren't really useful, at least not to me. I can get all the information I need from the frequency response curves and the normalized sonograms. But I've still got the data and it's little effort to generate them, so here they are.
Attachments
I think they're referenced to 0, so the 'bloom' you see at 7kHz is really the on-axis dip affecting the data normalization.
Saurav,
Initially I was inclined to think the same. But while looking at the plots with more scrutiny: The blooming does not concentrate on that dip, but starts just above that dip. It is clearly manifested in the second diagram of the PDF in the 6-10 kHz region.
That's fine, it would not change the response dramatically.
No, it's not much of a problem, but it's still something you'd want to know. It does change the response.
It is possible, but you need to trick out ARTA:Unfortunately it is not possible in Arta to normalize the response using the data of 15 or 30 degrees (?). That angle would be the listening axis, but the normalized data at 0 degrees shows pretty well what is going on.
Rename your "xxx_deg+15.pir" to "xxx_deg+0.pir" and subtract 15 from all other measurements file names. Similar could be done for every angle you want (and have measured)
.You would have to correct the angle labeling in the polar-/sono-diagrams accordingly.
- Home
- Loudspeakers
- Multi-Way
- Comparison Bohlender & Graebener Neo3W and Neo3PDR in dipole mode