Starting to post my results: http://sites.google.com/site/drivervault/driver-measurements
I forgot the nearfield frequency response measurements, I'll get them tomorrow. I did power compression testing tonight. I used ten minutes of pink noise at 105 dB @ 1m. Haven't decided how I'm going to post the info since it's just numbers. Not that it matters much. The differences were tiny and within the margin of error they all pretty much performed perfectly. This amount of power is incredibly loud. There is NO WAY any of us would approach this amount of power for even 1 minute in even the most over the top home theater. I am going to take the TD15M and 15NW76 on an extended test to get a better idea of the relative performance of the respective cooling methods, but this is mostly academic. With these pro woofers you will never push them hard enough for power compression to matter in home use. I thought for sure there would be a big difference, because those cones were moving!
Distortion and *hopefully* the Klippel based xmax method will be finished Tuesday.
This is a new site, so don't be surprised if it's different every time you go there. Also all of the results will be added as I finish up testing and move on to horns. Be sure to read the main page before you ask about test conditions.
Augerpro came over and borrowed a big pile of drivers from me on Sunday morning, so you can now see the results from the GPA 414 (16-ohm Alnico), 18Sound 12NDA520, and the AESpeakers TD15LO posted at Augerpro's DriverVault site.
Looking forward to seeing more data - what's already posted is looking very interesting.
Looking forward to seeing more data - what's already posted is looking very interesting.
augerpro said:This is a new site
The 1.6Meg images are really unnecessary.
Here's a compressed version that is 100 times smaller and 100 times faster to load and easier on bandwidth.
Irfanview can convert all your files in a batch.
Attachments
augerpro said:Starting to post my results: http://sites.google.com/site/drivervault/driver-measurements
I forgot the nearfield frequency response measurements, I'll get them tomorrow. ...
Be sure to read the main page before you ask about test conditions.
Great! To show the performance of Your own drivers nothing would do better than that. On the other hand Your competitors may have an eye on it and argue that Your data is corrupted for advertizing porposes? Certainly not me.
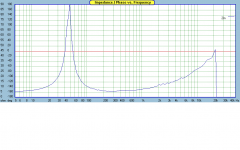
But I found something to complain. The Amplitude response could be shown over a smaller range to gain a higher resolution. 50dB should be enough.
In spite of L(x) I would display the intermodulation directly. The L(x) curve may be interesting for the chassis designer, but us as custumers want to know what comes out. I know IMD is hard to show to a satisfying extent. Prof Klippel did some work on that.
Re: Re: Driver testing results
Wha? I work at an oil refinery. No drivers being designed or sold by me.
I didn't notice the files were so big, I have a pretty fast connection. I'll look into shrinking them down.
wxa666 said:
Great! To show the performance of Your own drivers nothing would do better than that. On the other hand Your competitors may have an eye on it and argue that Your data is corrupted for advertizing porposes? Certainly not me.
Wha? I work at an oil refinery. No drivers being designed or sold by me.
I didn't notice the files were so big, I have a pretty fast connection. I'll look into shrinking them down.
augerpro said:Starting to post my results: ...
Thanks for doing this! IMHO, we need more data on drivers. I look forward to seeing your work.
dantheman said:When trying to go to your site my browser says it's exceeds the bandwidth.
Man I was hoping to see your site. I've looked at you photobucket many times. Thanks for all the hard work!
Dan
Indeed, thanks for the hard work!
It's a pain to test and publish drivers, so thanks for the legwork.
augerpro said:I usually use gif or jpg, but thought I'd stay with bmp since it looks the best for graphs. I didn't realize bmp were huge.
Back to testing...
Don't use JPG cos the lossy compression ruins the readability of graphs. Use PNG which is a widely supported open source lossless compressed format, similar to GIF but no loyalty worries and much higher colour limit.
Look forward to seeing results.
Member
Joined 2003
I agree fully with richie00boy, PNG is the GIF of the future. It is a lossless format, the larger the blocks of solid colour the better it will compress, making it excellent for graphs and diagrams, not so excellent for photo. For photo, JPG was designed for this purpose. Unlike GIF, it is free and is not limited by a 256 colour palette.
Seriously, save even the high resolution BMP chart as PNG and look at the file size, you may be surprised!
Augerpro, many thanks for publishing your measurements online, very good to see 3rd party measurements of drivers, the more the merrier!
Seriously, save even the high resolution BMP chart as PNG and look at the file size, you may be surprised!
Augerpro, many thanks for publishing your measurements online, very good to see 3rd party measurements of drivers, the more the merrier!
Ok site re-opened and the files are MUCH smaller. I forgot the nearfield frequency response measurements again, but I'll get them up in a couple days. I also did not get the Klippel Xmax testing started, but I did put some distortion plots. Not exactly the same as I used to do, but I'm trying to get relevant data while not taking a huge amount of time to do it. Also I noticed a couple random measurements are missing, so I'll get them up as soon as I can.
Thank you for all kind comments, I'm glad the community finds this value!
Thank you for all kind comments, I'm glad the community finds this value!
Re: Re: Driver testing results
I strongly agree. Also, is it really necessary to use such a large frequency range? For, say, a 12" driver, a 50 dB amplitude range and 20-10k Hz on the frequency axis should make it easier to see what's going on and still contain all the relevant information.
wxa666 said:But I found something to complain. The Amplitude response could be shown over a smaller range to gain a higher resolution. 50dB should be enough.
I strongly agree. Also, is it really necessary to use such a large frequency range? For, say, a 12" driver, a 50 dB amplitude range and 20-10k Hz on the frequency axis should make it easier to see what's going on and still contain all the relevant information.
Nice. Can always use more sources for driver measurements! Looking forward to it. And yeah, definitely use PNG. I hope a lot more info gets posted, as there's hardly anything up at the moment. Let's gather as much impossible-to-find information as possible.. Everyone, send augerpro all your drivers!..haha. 
Thanks again for doing the measurements. As Mark mentioned over on AVS it would also be interesting to have a single graph to show comparison of all drivers in a certain aspect. For example H2 distortion of all the 12" drivers tested in one graph, H3 distortion of all on another, etc to get an easy comparison.
John
John
All files are in PNG now. I also added nearfield frequency response plots and a two tone IMD plot. Xmax testing this weekend is all that is left. But I think the results so far already pointing to the leaders, this weekend shouldn't be a big surprise.
BTW I'll have some drivers for sale after this weekend.
BTW I'll have some drivers for sale after this weekend.
- Status
- This old topic is closed. If you want to reopen this topic, contact a moderator using the "Report Post" button.
- Home
- Loudspeakers
- Multi-Way
- Driver testing results