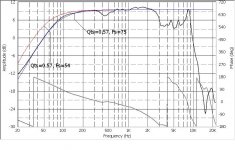
I'm a bit lost regarding this matter. I have measured nearfield, and I obtain a clean curve, useful from 700Hz and downwards. I also measured the impedance and I got a Fs of 54Hz, and the estimation of the Q is 0.57.
I understand that the poles you get from the impedance curve are the poles of the transfer curve of the SPL (if measured without effects of any resonant system, be it a closed box or a reflex system). I measured nearfield (2cm) with the driver mounted in a dipole, which is kind of free air (you should expect a bit higher Qts, and a lower Fs, but that's all).
Well, If I draw the bass response and the transfer curve of Fs=54 and Qts=0.57, they just don't match.
You can see in the picture, that the resulting Q is equal, but not the Fs!!!!
I understand that the factor that can alter the poles evaluation is the inductance, but in this case the value is really small. Another thing could be that the Q is very small, but clearly this is not the case.
Any hint?
Attachments
sometimes there can be a difference between the peak in the impedance magnitude curve and the 0° crossing of the impedance phase curve. Some say that the zero phase crossing is a more accurate measure of Fs. Do you have enough resolution on your impedance measurement? What are the frequency steps?
Do you see a difference between the frequency of the peak resonance impedance and the zero crossing of the phase response? Does either agree with the measured 75Hz roll off.
If not then something else is at work here. How does the impedance test differ from the SPL test? There must be a difference somewhere.
It's time for the Sherlock Holmes hat
Ok, I didn't know there can be that difference. I look sometimes to the peak, but mainly on the phase as it's easier for the eye.
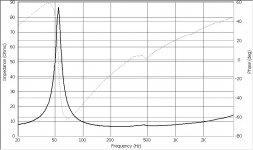
The impedance measurement is attached. I used different sample sizes and resolution but there were no significant deviations. You can see that the zero and peak are at the same frequency.
With this impedance test, the Q is about 0,57, Fs=54Hz. The transfer curve of that system is plotted in my first post, together with the actual SPL measurement nearfield.
Looking for measurement mistakes, I have calibrated the impedance setup and is getting good results with resistors.
Is correct that a nearfield measurement is showing just the transfer curve of the driver, without any other superimposed like baffle step, or any other?
Attachments
If the speaker was mounted and tested the same in both tests then the data should agree.
The impedance plot looks like a curve of a single driver but you say the SPL is a dipole - you mean two speakers?
Drive level can affect Fs too with higher driver levels lowering Fs. What was the voltage across the speaker in both tests?
The impedance plot looks like a curve of a single driver but you say the SPL is a dipole - you mean two speakers?
Drive level can affect Fs too with higher driver levels lowering Fs. What was the voltage across the speaker in both tests?
Hi,
The driver impedance indicates Fs = 54Hz, and Q ~ 0.57.
The measured response (nearfield) seems to follow Fs = 75Hz ?
I've had a look around and no-one seems to measure the bass
response of the driver in a baffle, they simply trust the derived
parameters and then measure the actual response in a box.
Nearfield measurements for a closed box are accurate to DC,
but I cannot find any criteria for open baffles, which must go
wrong at some point, i.e. they cannot measure DC .....
I might be barking up the wrong tree ... how big is the bipole ?
/sreten.
The driver impedance indicates Fs = 54Hz, and Q ~ 0.57.
The measured response (nearfield) seems to follow Fs = 75Hz ?
I've had a look around and no-one seems to measure the bass
response of the driver in a baffle, they simply trust the derived
parameters and then measure the actual response in a box.
Nearfield measurements for a closed box are accurate to DC,
but I cannot find any criteria for open baffles, which must go
wrong at some point, i.e. they cannot measure DC .....
I might be barking up the wrong tree ... how big is the bipole ?
/sreten.What method are you using to derive the driver parameters? The original method proposed by Small can be very unrliable.
The best method is to fir the measured impedance curve with an equivelent circuit model of the driver. It is crtitical for an unbaffled driver that this model includes a lossy inductor to simulate suspension creep.
With the correct model, I usually would expect to get a match between nearfield measurement and calculated response to within about 0.5dB.
I have not recent data on an unbaffled driver t show you, so I will try and find time tomorrow to do this.
You should bear in mind that drive level will affect your measurements. It is important to match the level when measuring the frequency response to that used when measuring the impedance. If you derive the impedance measurement by putting a large value resistor in series with the driver then you will significantly alter the drive level across the speaker, and this can greatly affect the results.
Andrew
There is probably some cancellation taking place even with the microphone so close to the driver, these wavelengths are very long. Try measuring it in a sealed box or in infinite baffle conditions.
Usually the accuracy is excellent at low frewuencies when measuring that close (apart form the baffle step that is missing in that measurement). At higher frequencies you will usually have cancellations and such with the nearfield measurement.
Another thing that males me wonder: Do you know the accuracy of your microphone, mic preamp etc ?
Regards
Charles
Iain McNeill said:The impedance plot looks like a curve of a single driver but you say the SPL is a dipole - you mean two speakers?
Drive level can affect Fs too with higher driver levels lowering Fs. What was the voltage across the speaker in both tests?
With dipole I mean open baffle, alla Linkwitz. I didn't make any voltage measurement, I simply adjusted the level to be not too loud (80db?). What could be the reason for the drive level to change the Fs??
sreten said:Nearfield measurements for a closed box are accurate to DC,
but I cannot find any criteria for open baffles, which must go
wrong at some point, i.e. they cannot measure DC .....
I might be barking up the wrong tree ... how big is the bipole ?
To measure a nearfield open baffle is similar to a closed box one, if done nearfield. Once you go further, the dipole response starts to appear. But nearfield wise, it should be the same as a closed one.
The dipole is not that big, you can see it here: http://www.diyaudio.com/forums/showthread.php?postid=480873#post480873
Eva said:There is probably some cancellation taking place even with the microphone so close to the driver, these wavelengths are very long. Try measuring it in a sealed box or in infinite baffle conditions.
I guess that any cancellation should appear at the impulse response, and actually I measured this (with ARTA). I changed the time window and no reflection was observed and no change in the bass response (apart from the bass limitation of course)
AndrewJ said:The best method is to fir the measured impedance curve with an equivelent circuit model of the driver. It is crtitical for an unbaffled driver that this model includes a lossy inductor to simulate suspension creep.
Thanks for the hint. This is unknown to me, where could I get more information on this?
AndrewJ said:If you derive the impedance measurement by putting a large value resistor in series with the driver then you will significantly alter the drive level across the speaker, and this can greatly affect the results.
Andrew
Thanks, I didn't notice that with the resistor in series was halving the voltage. I thought that this resistor was changing the damping of the system, as it's in series with the amp. I have at the moment 8,2 Ohm. I can put one or two in parallel easily, so to try is quick.
phase_accurate said:Another thing that males me wonder: Do you know the accuracy of your microphone, mic preamp etc ?
Charles
I'm using a panasonic capsule, with linkwitz modification, a very accurate mic preamp with transformer coupling, and a Pandora box I designed for handling/switching all the signals (kind of a jig). I don't expect to have accuracy problemas apart from the mic, but I will try to calculate/estimate the precision of the system. I would be surprised if this is the reason, but of course, I have to check.
Raka said:
To measure a nearfield open baffle is similar to a closed box one, if done nearfield. Once you go further, the dipole response starts to appear. But nearfield wise, it should be the same as a closed one.
The dipole is not that big, you can see it here: http://www.diyaudio.com/forums/showthread.php?postid=480873#post480873
I guess that any cancellation should appear at the impulse response, and actually I measured this (with ARTA). I changed the time window and no reflection was observed and no change in the bass response (apart from the bass limitation of course)
This is an over-simplification. It does not hold at DC so there should be a low frequency limit.
The microphone is onmidirectional and it will be always picking up the sum of both the fromt wave and the rear wave (with proximity effect gain and the delay and attenuation from whatever obstacles they find in its way) regardless of position.
At, say 50Hz, even when you measure with the microphone 2cm away from the woofer, the capsule is picking up both the front wave with gain due to proximity effect and the rear wave with maybe 40cm delay (21 degree lag) and 7.6dB attenuation with respect to the front wave. If you do the math, this gives 4dB attenuation.
You won't see this as echoes in the impulse response because high frequency components of the back wave won't reach the microphone, but much longer wavelenghts (50Hz --> 6.9 meters) will have an impact.
BTW: Have you studied the origin of the 420Hz notch?
BTW: Have you studied the origin of the 420Hz notch?
It does at least not seem to be caused by the front-to-back path difference. But I don't think that this is severe at all because:
1.) It is only 2 dBs
2.) I assume that the mid has already taken over at this frequency when used as intended.
3.) The response of this subwoofer driver shows astounding linearity up to quite high frequencies.
Regards
Charles
Eva said:This is an over-simplification. It does not hold at DC so there should be a low frequency limit.
Let me ask you something: the impact of this effect will depend on frequency, and will start to be readily apparent once the baffle dimensions are not so small compared to the frequency. But In my case, both curves are identical in Q, and in the filter order (2nd).
phase_accurate said:1.) It is only 2 dBs
2.) I assume that the mid has already taken over at this frequency when used as intended.
3.) The response of this subwoofer driver shows astounding linearity up to quite high frequencies.
Actually, this is the midrange response, and due to the nearfield measurement, you can not trust the SPL measurement past 800Hz.
I think the notch is inherent to the driver, and the shape of the dust cover.
Raka said:But In my case, both curves are identical in Q, and in the filter order (2nd).
Instead of assuming they "are" identical, one might remark that they "appear" identical in slope, but only from ~30-70Hz. You may be chasing your tail over nothing.
I would also concur with Eva. You cannot do nearfield with a dipole as you are not going to get something for which there is an easy model. Dipoles can be very tough to model because the baffle size (and shape) will have a big effect.
You would have to look at some much more sophisticated models of a source in a finite baffle to get accurate results in this case. This problem has been done, it was in JASA some 40 or more years ago. It involves using Oblate Spheriodal coordinates as this can model a finite source in a finite baffle, but only if both are round. You may want to look this up if this is an important problem, but the bottom line is that nearfield for a dipole is not going to be accurate. Use a small box instead.
You would have to look at some much more sophisticated models of a source in a finite baffle to get accurate results in this case. This problem has been done, it was in JASA some 40 or more years ago. It involves using Oblate Spheriodal coordinates as this can model a finite source in a finite baffle, but only if both are round. You may want to look this up if this is an important problem, but the bottom line is that nearfield for a dipole is not going to be accurate. Use a small box instead.
Thanks for the reply. I understand that the nearfield measurement is not "free" of the dipole effect, since the first agent to appear maybe is not the floor reflexion, but the backwave. Taking for example a baffle around 400mm (mine has 300mm width and 88mm wings), means that maximum time window is 0,4/343m/s, which is 1,1ms, so you could measure down to 850Hz, which is more or less the upper limit for nearfield measurement. Hence, this method is already disqualified and we are not even talking about irregularities in the radiation pattern.
So, I'm now considering that the notch is not coming from the driver or nearfield measurement, but from the dipole radiation pattern.
My target is to get a better understanding and maybe a better filtering for my current system, in order to learn something to develop the next one. At this moment I'm making measurements with the dipole in a semi-outdoor test bench (the dipole is on a pedestal, so the midwoofer is at 2300mm over the floor).
Using a small closed box I can get information of the driver, with the Fs and Q values, but... how could I say that the free air values are the values of the driver in the dipole? I guess there is not big difference being the Fs lower and Qts higher, but...
For the filtering, would be useful to know the actual poles of the transfer function of the driver. If I could get those values, I could identify the other parts easier (2PI to 4PI transition, dipole cancellation, notch)
AndrewJ, could you please indicate where could I get more information or description on the estimation method you mentioned?
Please see my article of dipole SPL variation with listening distance. It shows that as the listening distance (or mic position) becomes close to the front source the SPL response will reduce to that of a monopole source at low frequency, scaled in amplitude. This particular presentation is a simplified formula not valid as the distance from the front source goes to zero. The complete formula is valid as distance goes to zero and is given in Kinsler and Frey, “Fundamentals of Acoustics”. The bottom line is that as the mic is placed close to the front source of a dipole the SPL response below a certain frequency becomes that as if the dipole were a monopole but at a weaker strength. The reason for this is because when the wave length is much greater than the mic distance from the front source, the phase differences don’t matter so much as the relative differences in strength between the front and rear sources. As the distance from the front source becomes extremely small, as in a near field measurement, the measured response becomes that of the front source alone. The figure below shows the result for a dipole with effective separation of ½ foot at various distances using the complete analysis. In other words, the procedure I give for obtaining the low frequency response of a dipole using near field measurements and merging it with the far field measurement is correct.
An externally hosted image should be here but it was not working when we last tested it.
- Status
- This old topic is closed. If you want to reopen this topic, contact a moderator using the "Report Post" button.
- Home
- Loudspeakers
- Multi-Way
- Transfer function. Poles not where expected