I'm trying to measure the phase response of my drivers and the results I'm getting aren't what I expected. Has anyone successfully measured the phase response of their speakers?
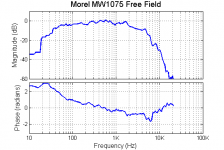
I'm using an MLS test signal with a microphone at 1m on axis with the driver in a sealed cabinet measured out in the garden. With the electrical MLS signal used as a reference, the measured phase response also includes the delay due to the 1m travel time.
What I've done is subtract out a correction phase response corresponding to a pure time delay and iteratively tweaked the time delay to get the gentlest phase curve for the driver response (excess phase?) I've attached the response I got.
Does this look right? I guess I'm having problems with the low frequency acoustic output leading the electrical signal in. If I invert the signal from the microphone things look better but then my impulse response is upside down (peaks negative)
Attachments
You can apply a Hilbert-Bode transform (HBT) to your amplitude FR data to get the minimum phase response. Should give same result as your subtraction of distance data.
Getting the low frequency response right depends on a few factors:
1) Level of electrical noise in your measuring equipment (gets worse as you approach DC)
2) Sampling rate (you get better resolution at lower sampling rates)
3) Reflection off adjacent objects (do nearfield measurement of LF drivers, then splice them to you far field data of the whole system).
Of course, the Hilbert Transform, thanks for helping with the Alzheimers
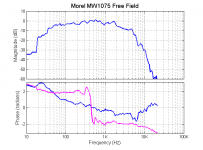
Plotting HT on the same chart I get the attached so I guess I got some work to do. I'll try your suggestion of splicing near field measurements at different sample rates together using the free field as a paste template.
Great suggestions, thanks again!
Plotting HT on the same chart I get the attached so I guess I got some work to do. I'll try your suggestion of splicing near field measurements at different sample rates together using the free field as a paste template.
Great suggestions, thanks again!
Attachments
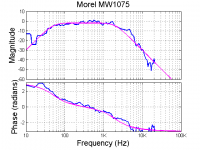
As a sanity check I simulated a butterworth 2nd order high pass at 50Hz together with a 2nd order low pass at 2000Hz and compared to what I measured. It actually compared quite favorably. I tweaked the delay time compensation a bit more and got the attached curve which is pretty convincing in my mind.
So why didn't the Hilbert Transform agree? Hmmm.
So why didn't the Hilbert Transform agree? Hmmm.
Attachments
Iain
I believe that the effectiveness/accuracy of the HBT is dendent on the "rightness" of the data at the extremes of the FR plot, now that I think of it. So, achieving minimum phase response with HBT requires a bit of extra work. In the referenced document, the FR plot needs to be manipulated to get HBT to work correctly ("tailing off" at the extremes).
Acoustic Centre Evaluation using HBT
You only need adjust the model
If you're using an MLS system with a good card that doesn't roll off prematurely and have calibration data for the mic to correct for its response, the result will have accurate phase data to the limit of your measurement system and the calibration data. This will be the driver minimum-phase plus the excess-phase due to the time-of-flight from the driver's acoustic center to the mic center (very close to the tip usually).
What you need to do to get correct minimum-phase response is to create a model that is close at the extremes, then adjust until the phase matches. The highpass is pretty easy. For a tweeter you easily get a good measurement of the highpass. The extension of the slope (tailing) is usually a simple matter, most often 12db. For a woofer, mid-woofer or midrange, you can use the box model from T/S parameters or estimate the Fb and tweak the highpass to get the match. The lowpass for most drivers requires some trial-and-error to estimate it. Programs such as SoundEasy make this a pretty easy task. You can also use the FRC from the FRD consortium.
Tweeters usually need a lowpass around 20K or 30K depending on the typical extension of that driver. I usually take the manufacturers response as being typical and start from there. If your measurement system stops at 20K, you can extend to flat above, then roll off and check the HBT and change slope/Fc until you get match. Done right the phase always matches after a few attempts.
I've come to like SoundEasy for creating models for minimum-phase when needed. If optimizing in CALSOD, I now just use direct measurements taken from the design point.
Dave
HiFiNutNut said:So if our interest is to get accurate phase for at least 20Hz to 20kHz from HBT, what are the extremes of the frequencies should we use for measurement of amplitude response, which is realistic with normal mics and soundcards, for example, from 5Hz to 40kHz?
If you're using an MLS system with a good card that doesn't roll off prematurely and have calibration data for the mic to correct for its response, the result will have accurate phase data to the limit of your measurement system and the calibration data. This will be the driver minimum-phase plus the excess-phase due to the time-of-flight from the driver's acoustic center to the mic center (very close to the tip usually).
What you need to do to get correct minimum-phase response is to create a model that is close at the extremes, then adjust until the phase matches. The highpass is pretty easy. For a tweeter you easily get a good measurement of the highpass. The extension of the slope (tailing) is usually a simple matter, most often 12db. For a woofer, mid-woofer or midrange, you can use the box model from T/S parameters or estimate the Fb and tweak the highpass to get the match. The lowpass for most drivers requires some trial-and-error to estimate it. Programs such as SoundEasy make this a pretty easy task. You can also use the FRC from the FRD consortium.
Tweeters usually need a lowpass around 20K or 30K depending on the typical extension of that driver. I usually take the manufacturers response as being typical and start from there. If your measurement system stops at 20K, you can extend to flat above, then roll off and check the HBT and change slope/Fc until you get match. Done right the phase always matches after a few attempts.
I've come to like SoundEasy for creating models for minimum-phase when needed. If optimizing in CALSOD, I now just use direct measurements taken from the design point.
Dave
Thanks Dave,
If I can try and paraphrase you here just to see if I'm comprehending properly....
I would get a much better agreement with the Hilbert transform if I clean up the upper and lower roll off "tails" of the measured data as they hit the noise floor. Seems like you're suggesting that I "fade" my measured upper & lower roll off's to modelled roll offs - this would effectively buy more signal to noise right?
My woofer is rather underdamped in it's sealed cabinet and so deviates from the butterworth model. I hadn't considered this as a source of error. However, I did try doing a HT of the magnitude response of the modelled bandpass from post 4 and got excellent agreement between HT phase and modelled phase........after I multiplied the HT phase component by -2

All this still seems to confirm that my measurements are correct although perhaps not precise. As I'm trying to get my XO tuned in for the burning amp event I think I'm going to proceed with this data for now. The HT review may have to wait til later.
If I can try and paraphrase you here just to see if I'm comprehending properly....
I would get a much better agreement with the Hilbert transform if I clean up the upper and lower roll off "tails" of the measured data as they hit the noise floor. Seems like you're suggesting that I "fade" my measured upper & lower roll off's to modelled roll offs - this would effectively buy more signal to noise right?
My woofer is rather underdamped in it's sealed cabinet and so deviates from the butterworth model. I hadn't considered this as a source of error. However, I did try doing a HT of the magnitude response of the modelled bandpass from post 4 and got excellent agreement between HT phase and modelled phase........after I multiplied the HT phase component by -2
All this still seems to confirm that my measurements are correct although perhaps not precise. As I'm trying to get my XO tuned in for the burning amp event I think I'm going to proceed with this data for now. The HT review may have to wait til later.
The model is important
The tails serve two purposes. One, as you point out, they replace the "noisy" area, so-to-speak, since the data you'll get in the measurement will get lost in the noise floor at some point. But more importantly, they provide extended data in a reasonable manner to allow the software to provide a more accurate HBT. If the data is truncated, the software may extend the data on its own, sometimes flat from the last data point that may easily introduce additional error. Drivers are known to have a fairly narrow range for the lowpass rolloff, so making an assumption for the purpose of achieving a more accurate phase response in the measured region is both practical and realistic.
I'm not sure what you mean by that last sentence. I assume that this means that you altered the slope of the SPL highpass response in the model. It may take several attempts to match the phase closely.
Woofers and midwoofers often have steeper lowpass slopes due to various reasons, diaphragm material, profile, damping, etc, at least for the initial response. They sometimes turn down more sharply after some initial rolloff, so each driver has to be considered individually. The highpass for a driver in a closed box may vary, but it will asymptote to 2nd order in any case.
Correct but not precise? What does the driver with crossover response look like?
Dave
Iain McNeill said:Thanks Dave,
If I can try and paraphrase you here just to see if I'm comprehending properly....
I would get a much better agreement with the Hilbert transform if I clean up the upper and lower roll off "tails" of the measured data as they hit the noise floor. Seems like you're suggesting that I "fade" my measured upper & lower roll off's to modelled roll offs - this would effectively buy more signal to noise right?
The tails serve two purposes. One, as you point out, they replace the "noisy" area, so-to-speak, since the data you'll get in the measurement will get lost in the noise floor at some point. But more importantly, they provide extended data in a reasonable manner to allow the software to provide a more accurate HBT. If the data is truncated, the software may extend the data on its own, sometimes flat from the last data point that may easily introduce additional error. Drivers are known to have a fairly narrow range for the lowpass rolloff, so making an assumption for the purpose of achieving a more accurate phase response in the measured region is both practical and realistic.
My woofer is rather underdamped in it's sealed cabinet and so deviates from the butterworth model. I hadn't considered this as a source of error. However, I did try doing a HT of the magnitude response of the modelled bandpass from post 4 and got excellent agreement between HT phase and modelled phase........after I multiplied the HT phase component by -2
I'm not sure what you mean by that last sentence. I assume that this means that you altered the slope of the SPL highpass response in the model. It may take several attempts to match the phase closely.
Woofers and midwoofers often have steeper lowpass slopes due to various reasons, diaphragm material, profile, damping, etc, at least for the initial response. They sometimes turn down more sharply after some initial rolloff, so each driver has to be considered individually. The highpass for a driver in a closed box may vary, but it will asymptote to 2nd order in any case.
All this still seems to confirm that my measurements are correct although perhaps not precise. As I'm trying to get my XO tuned in for the burning amp event I think I'm going to proceed with this data for now. The HT review may have to wait til later. [/B]
Correct but not precise? What does the driver with crossover response look like?
Dave
However, I did try doing a HT of the magnitude response of the modelled bandpass from post 4 and got excellent agreement between HT phase and modelled phase........after I multiplied the HT phase component by -2
Perhaps I should 'fess up to being a MATLAB user. The function I am using 'hilbert()' has no modifiers and is designed to take a magnitude only time domain signal and provide the corresponding analytic (complex) time based signal. I used this function on the frequency domain magnitude response I had to compute a frequency domain phase response.
I assumed that time/frequency domain equivalence would be upheld. I'm not so sure now and so this may not be a valid use case - this is what I need to research.
All I was saying was that I noticed that the HT phase component I got (unwrap(angle(hilbert(mag_response)))) was mirror image and smaller. When in trouble, I do everything by 6dB. This time I got lucky - +6dB and 180degrees made it match - perfectly. Always suspicious in my book.
Correct but not precise? I mean the method is OK but the data is compromised. Am I ±3dB? no idea. I can tell you what it sounds like!!!
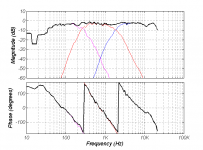
I wondered if you'd ask about the "post-XO" response. Here it is together with how it sums:
There's no driver correction on thins.
Attachments
Hi Jurgen,
All the data I'm showing here is for a single driver except for the last plot which is a mathematical sum of the expected driver outputs (i.e. the crossover function modified by the driver response.) I don't see why a well designed multi-way speaker can't be minimum phase. In my mind, it's an excellent target.
I don't think I can give a good definition of minimum phase. To me it means that you've removed all the delay/latency related phase noise and gotten down to the actual "black-box" phase response of the device your talking about. In this sense, everything real has a minimum phase response.
Then there's linear phase and excess phase which are both equivalent to a pure delay/latency but linear phase is what you shoot for in a design while excess phase is what you have to get rid of to see your true "phase response"
I'm not sure I'm right though, this is deep stuff...anyone??
minimum phase is an excellent target, a multiway speaker behaving like a single driver or a equivalent bandpass with nice rolloff at the ends and nothing nasty in between is some sort of holy grail.
Well not exactly - but you will have to sacrifice other things. But like John Watkinson says: "It can all be put into practice".
Regards
Charles
Iain McNeill said:
Perhaps I should 'fess up to being a MATLAB user. The function I am using 'hilbert()' has no modifiers and is designed to take a magnitude only time domain signal and provide the corresponding analytic (complex) time based signal. I used this function on the frequency domain magnitude response I had to compute a frequency domain phase response.
In all probability MathLab impliments a Discrete HBT. It has no parameters as the DHBT has implied behavior at the fequency extremes with the result that the phase at the frequency extremes may be in question. The DHBT phase is usually ok mid band.
Hi Guys
With the discussion about how to get to the real acoustic phase response (a key interest of mine), I wonder if any of you guys have considered using a tef machine that is to say TDS.
Unlike the MLS and FFT based systems like Smaart ets, TDS actually measures phase without the phase errors the FFT and MLS systems usually display in a “reality check”.
There is no need to apply a Hilbert transform, one only needs to measure Time first to remove the fixed delays.
Also the Hilbert assumption is only valid when the driver is a minimum phase device, in reality most drivers have some amount of non-minimum behavior as well.
The TDS process actually measures phase regardless if it is minimum or not.
"minimum phase is an excellent target, a multiway speaker behaving like a single driver or a equivalent bandpass with nice rolloff at the ends and nothing nasty in between is some sort of holy grail.
Well not exactly - but you will have to sacrifice other things. But like John Watkinson says: "It can all be put into practice"."
I would disagree, on the second part, it is possible to do AND also produce a radiation pattern of ONE CD source with no lobes or beaming, even using a passive crossover..
For the last 8 years I have been a designing speakers that do just that, beginning with the Unity horns here;
http://www.servodrive.com/SPL-td1.html
And for the last two years the improved versions using the synergy horn here;
http://www.danleysoundlabs.com/
While these are all more powerful than needed for the home and not styled for the home many hifi types describe the sound as like an effortlessly dynamic electrostatic.
These are typically used in large rooms for the highest possible sound quality.
I posted the impulse and square wave responses in the past for one of them, the SH-50.
If you download the spherical measurements and the CLF viewer and look at the measurements, you can see the crossover points are invisible in the radiation pattern as well as phase.
Best,
Tom Danley
What kind of phase errors are you talking about ?Tom Danley said:....
Unlike the MLS and FFT based systems like Smaart ets, TDS actually measures phase without the phase errors the FFT and MLS systems usually display in a “reality check”.
Tom Danley
Hi
I post here and Audio Asylum for fun, hifi is my hobby, what drives me, I work in Pro-sound and post on a forum called Pro-sound Web.
Back when I was working on the first of these speakers, I saw a measurement made by a new program called Smaart which didn’t look the same as my tef measure (I have had tef machines to use at work since the 1981).
I posted that to Sam (its developer) on PSW and was told the tef didn’t measure phase properly and was also flooded with responses from Smaart users with many explanations and math.
I devised a reality check that I have used ever since.
In making some suggestions to one of the presenters at a recent Synaudcon seminar, I mentioned this phase measurement issue and he used it at the seminar causing some considerable head scratching.
Anyway here is what to do.
Set up a loudspeaker processor to have a high pass Butterworth 4th order filter at say 200Hz and add a low pass 2nd order at say 5000Hz.
Now you have a “perfect” known loudspeaker response with zero room noise etc.
Add 3 or 4 ms delay to the system to simulate the time delay between the microphone and speaker.
Model the mag and phase of this filter portion in a filter modeling program (not including the time delay) so you know what the proper amplitude and phase looks like when all the fixed delay is removed (the computer model of the filter has this view, Time = 0).
Now, substitute the loudspeaker controller for system under test, a direct loop in /out.
Measure the controller as if it were a loudspeaker.
If the measurement system is a “Real Poncho” and not a “Sear’s Poncho” (apologies to frank Zappa), it will show an amplitude and phase exactly or at least very similar to the computer model of that filter set.
The TEF passes this test*, I have not seen any others that have without fudging the curve to make it “look right” (which doesn’t help with an unknown system) and many having large error in the phase slope and even direction at the edges.
*this (currently) requires the Time to be precisely measured prior to measuring amplitude and phase.
I have a write up that I need to finish and get up on our web site but I hope this helps.
Best,
Tom Danley
Tom Danley said:Hi Guys
With the discussion about how to get to the real acoustic phase response (a key interest of mine), I wonder if any of you guys have considered using a tef machine that is to say TDS.
Unlike the MLS and FFT based systems like Smaart ets, TDS actually measures phase without the phase errors the FFT and MLS systems usually display in a “reality check”.
There is no need to apply a Hilbert transform, one only needs to measure Time first to remove the fixed delays.
Also the Hilbert assumption is only valid when the driver is a minimum phase device, in reality most drivers have some amount of non-minimum behavior as well.
The TDS process actually measures phase regardless if it is minimum or not.
The problem is not whether it's MP or not. The problem is what is the correct delay (time) to remove? I don’t see where TDS will aid in determining that.
Phase is always a relative measurement. That is, phase always consists of the native phase response of the driver plus a linear phase component representative of the delay from the measurement point to the acoustic center (AC) of the driver. If and only if the driver is MP is there a chance of determining where the AC is located relative to the measurement point (i.e. what the correct delay is). The question is where is the AC? There is only one way to determine that, at least approximately: Assume the driver is minimum phase. This is generally true. I have not seen any conventional driver that is not minimum phase well into their stop band when measured on axis. Assuming this, then it is possible to construct the minimum phase response of the driver and determine how much delay must be removed form the native response to match the HBT result. The problem with this is that the HBT requires additional info. If a discrete HBT is use (FFT based) the problem is that there is an assumption of periodicity which means that at (or near) the frequency extremes the phase must pass through zero. This is obviously a problem for a low pass response where the unwrapped phase at high frequency must approach -90 x N where N is the order of the LP response.
With an integral HBT (true HBT) the problem is that the integral must extend from DC to infinity. This problem is circumvented by adding analytical tails to the response. The caveat here is where to start the tails and what slope should the tail have. The high pass tail, at low frequency, isn't difficult since we usually know the drivers Fs and alignment. so we have a good ideal of the correct shape of the low frequency response. But the low pass tail at high frequency is more problematic. We are guided by the high frequency roll off of the driver but past break up it is often difficult to define the slope of the roll off. The problem here is that the amount of delay to be removed will vary with the slope. The higher the slope of the LP tail, the low the delay and the closed the apparent AC. Fortunately, this really doesn’t matter for CAD simulation. As long as a consistent HP tail slope and AC position is used the results will be correct if you match the measured phase.
There may be some problems at very high frequencies, above break up, because there is a possibility that above break up the response may deviate from minimum phase. But in the crossover region minimum phase behavior of a conventional driver is pretty much well assured.
- Status
- This old topic is closed. If you want to reopen this topic, contact a moderator using the "Report Post" button.
- Home
- Loudspeakers
- Multi-Way
- Measuring Phase Response of Drivers