Thank´s for your answer.
I´ll do this test with a). Smaart and b). WinMLS2004 tomorrow. I´ll post my results. BUT, as I have done it before I have to mention the DC-blocking in most speaker processors, both of mine have that anyways. This (usually 1st. order) slope will add to phase shift. Back tomorrow.
Tom Danley said:...
Set up a loudspeaker processor to have a high pass Butterworth 4th order filter at say 200Hz and add a low pass 2nd order at say 5000Hz.
Now you have a “perfect” known loudspeaker response with zero room noise etc.
Add 3 or 4 ms delay to the system to simulate the time delay between the microphone and speaker.
Model the mag and phase of this filter portion in a filter modeling program (not including the time delay) so you know what the proper amplitude and phase looks like when all the fixed delay is removed (the computer model of the filter has this view, Time = 0).
...
I´ll do this test with a). Smaart and b). WinMLS2004 tomorrow. I´ll post my results. BUT, as I have done it before I have to mention the DC-blocking in most speaker processors, both of mine have that anyways. This (usually 1st. order) slope will add to phase shift. Back tomorrow.
Hi Tom,
Thanks for your wise words. I've seen the TEF products and studied Heyser's work. But in my mind it has the same disadvantage as ESS (exponential swept sine) and impulse testing and that is low stimulus energy. To get enough signal-to-noise for a good measurement you need a long test stimulus and/or lots of averaging.
MLS on the other hand is blessed with high energy and the MLS I'm using is only 8191 samples long with no averaging. Without even setting levels for optimum I'm getting 60dB SNR (OK 30dB at low frequency) from my soundcard.
Having never used a TEF I'm sure there's some features to remedy this but the fact remains.
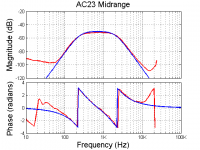
Using the measurement system to measure something you know is always a good reality check and I did check the midband on my Rane AC23 which is a 4th order L-R. The MLS measurement agrees with the simulated response excellently where there is good SNR as you can see from attached. Guess I get the "real poncho" pin
John,
Thanks for the help with the Hilbert Transform. You've educated me to the point where I now know what I don't know (step 1 right)
Thanks for your wise words. I've seen the TEF products and studied Heyser's work. But in my mind it has the same disadvantage as ESS (exponential swept sine) and impulse testing and that is low stimulus energy. To get enough signal-to-noise for a good measurement you need a long test stimulus and/or lots of averaging.
MLS on the other hand is blessed with high energy and the MLS I'm using is only 8191 samples long with no averaging. Without even setting levels for optimum I'm getting 60dB SNR (OK 30dB at low frequency) from my soundcard.
Having never used a TEF I'm sure there's some features to remedy this but the fact remains.
Using the measurement system to measure something you know is always a good reality check and I did check the midband on my Rane AC23 which is a 4th order L-R. The MLS measurement agrees with the simulated response excellently where there is good SNR as you can see from attached. Guess I get the "real poncho" pin
John,
Thanks for the help with the Hilbert Transform. You've educated me to the point where I now know what I don't know (step 1 right)
Attachments
Hi Iain
A couple thoughts, The TEF doesn’t normally use an exponential sweep, if it did, the process could be faster but less elegant in its functioning.
Both MLS and TDS suffer from having a “white” spectrum, which for measuring time is good but for frequency response is not so good (as a pink spectrum).
If I recall, MLS is theoretically 3dB greater energy so far as a signal goes but is more sensitive to time variance and non-linearity..
Contrary to your impression however, the TEF has superb noise immunity, I have heard negatives attributed to the TEF but never from anyone who uses both systems.
In a pinch, you can literally measure the response of a speaker with a crowd of people talking, while a vacuum cleaner is running and so on.
Its lack of popularity of the TDS is from the narrow license vs broad license approach, similar to the Beta tape VS VHS tape situation.
The TEF process is slower however, just “how slow” depends on how wide a bandwidth you wish to sweep AND what resolution you wish to have.
Higher resolution and/or wider BW = longer time.
For example, if one wanted to do a medium resolution sweep (like below) from 20Hz to 20KHz, and have 20Hz resolution, it takes 46 seconds.
Also, in order to measure acoustic phase correctly, one must first measure the time delay, a separate sweep which lasts several seconds.
On the other hand, unless one is measuring in a decent wind blowing or was using the FFT or RTA functions in the TEF, one normally doesn’t ever need to average.
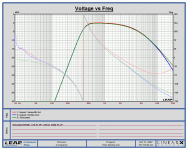
Below is a one sweep of a Xilica XD4080 controller I had handy, with a 200Hz high pass and 5KHz low pass 4th order Butterworth filters and 4 ms delay.
I plugged the output into the mic input so it reads about 130dB instead of zero (Voltage reference is set for microphone).
What I have seen from other systems is varying degrees of what yours and the other curves show, decent correlation in the middle but gets pretty flaky pretty to either side of center.
Also, some systems I have seen do not show the slope of the amplitude or phase properly when off center.
As in the curve below, a 4th order filter is suppose to show 360 degrees of rotation.
One can a “flaw” of the TDS process is the kink between 20 and 30 Hz which results from having an empty bin just below 20Hz.
To get rid of that step “kink” is to sweep lower than 20Hz and use more resolution, which makes for a longer sweep. On the other hand, it takes me days and days to work out a crossover so taking a minute to get a trustworthy measurement is no problem.
Also, the Goldline system is not your only choice; a newer program called EASRA does TDS measurements and is a nice (new) platform.
While the paper below has its own approach its promoting but it does have a decent overview of the possible ways to measure a speaker like this.
http://saturn5.com/~jwb/mueller.pdf
Best,
Tom Danley
A couple thoughts, The TEF doesn’t normally use an exponential sweep, if it did, the process could be faster but less elegant in its functioning.
Both MLS and TDS suffer from having a “white” spectrum, which for measuring time is good but for frequency response is not so good (as a pink spectrum).
If I recall, MLS is theoretically 3dB greater energy so far as a signal goes but is more sensitive to time variance and non-linearity..
Contrary to your impression however, the TEF has superb noise immunity, I have heard negatives attributed to the TEF but never from anyone who uses both systems.
In a pinch, you can literally measure the response of a speaker with a crowd of people talking, while a vacuum cleaner is running and so on.
Its lack of popularity of the TDS is from the narrow license vs broad license approach, similar to the Beta tape VS VHS tape situation.
The TEF process is slower however, just “how slow” depends on how wide a bandwidth you wish to sweep AND what resolution you wish to have.
Higher resolution and/or wider BW = longer time.
For example, if one wanted to do a medium resolution sweep (like below) from 20Hz to 20KHz, and have 20Hz resolution, it takes 46 seconds.
Also, in order to measure acoustic phase correctly, one must first measure the time delay, a separate sweep which lasts several seconds.
On the other hand, unless one is measuring in a decent wind blowing or was using the FFT or RTA functions in the TEF, one normally doesn’t ever need to average.
Below is a one sweep of a Xilica XD4080 controller I had handy, with a 200Hz high pass and 5KHz low pass 4th order Butterworth filters and 4 ms delay.
I plugged the output into the mic input so it reads about 130dB instead of zero (Voltage reference is set for microphone).
What I have seen from other systems is varying degrees of what yours and the other curves show, decent correlation in the middle but gets pretty flaky pretty to either side of center.
Also, some systems I have seen do not show the slope of the amplitude or phase properly when off center.
As in the curve below, a 4th order filter is suppose to show 360 degrees of rotation.
One can a “flaw” of the TDS process is the kink between 20 and 30 Hz which results from having an empty bin just below 20Hz.
To get rid of that step “kink” is to sweep lower than 20Hz and use more resolution, which makes for a longer sweep. On the other hand, it takes me days and days to work out a crossover so taking a minute to get a trustworthy measurement is no problem.
Also, the Goldline system is not your only choice; a newer program called EASRA does TDS measurements and is a nice (new) platform.
While the paper below has its own approach its promoting but it does have a decent overview of the possible ways to measure a speaker like this.
http://saturn5.com/~jwb/mueller.pdf
Best,
Tom Danley
Attachments
Great article Tom, I look forward to digesting it slowly.
Angelo Farina is one of my heros (reference 2) and it was a pleasure to meet him at last years AES show.
The distortion issue is the Achilles heel of MLS. I find it to be totally intolerant of distortion. Using ESS as Mr Farina points out, is perfectly happy with distortion, in fact it even sorts out all the harmonic components and presents them as their own impulse responses in time sequence of order.
I guess it's all about using the right tool for the job and I have convinced myself of the original question in the thread that I am, in fact, measuring the true phase response of my speakers. The caveats pointed out need to be considered but for the purpose of tuning my XO, I'm not too concerned with the out-of-band data once the magnitude is -20dB.
BTW, your TEF plot is impressively clean, especially at low frequency. However, not to pick nits or anything, it doesn't seem to be asymptoting to 360° at HF (did I read 375° at the end?) Maybe it's just the low pass being so close to nyquist?
CLG, thanks for taking the time to make some comparative measurements. Looks like something funny is going on with the Smaat Live measurement.
Great discussion, thanks all!
Hi CGL, Iain
I meant to say too that Smaart is an excellent tool, when you connect one to a Lake controller it is like magic so far as EQ’ing a system and it does lots of other cool stuff.
My reason for bringing this stuff up at all here is that your dealing with measuring individual drivers and then plugging the data into a computer model for a crossover design, the differences or errors seen in phase are enough to cause uncorrelated results.
Note both win-mls and Smart had nearly an identical phase error at the low end but had differing errors above. I have seen systems, which had amplitude errors as well.
In building the Unity and Synergy horns, I found that having the drivers so close together that they added coherently also required the phases to be “right” or funny stuff happened.
When everything was right, they all added together into one virtual broadband driver.
Anyway, I hope this might be of use for those struggling with crossovers.
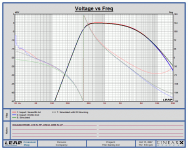
Iain, on the TEF graph, the phase at the hf end is progressively more dependent on the time being exact. Here I put in two 4th order filters so the total phase should be about 720 degrees, 360 degrees is at about the center. As one only has 10 microsecond “clicks” of adjustment in time, there is often a small phase error.
Best,
Tom Danley
I meant to say too that Smaart is an excellent tool, when you connect one to a Lake controller it is like magic so far as EQ’ing a system and it does lots of other cool stuff.
My reason for bringing this stuff up at all here is that your dealing with measuring individual drivers and then plugging the data into a computer model for a crossover design, the differences or errors seen in phase are enough to cause uncorrelated results.
Note both win-mls and Smart had nearly an identical phase error at the low end but had differing errors above. I have seen systems, which had amplitude errors as well.
In building the Unity and Synergy horns, I found that having the drivers so close together that they added coherently also required the phases to be “right” or funny stuff happened.
When everything was right, they all added together into one virtual broadband driver.
Anyway, I hope this might be of use for those struggling with crossovers.
Iain, on the TEF graph, the phase at the hf end is progressively more dependent on the time being exact. Here I put in two 4th order filters so the total phase should be about 720 degrees, 360 degrees is at about the center. As one only has 10 microsecond “clicks” of adjustment in time, there is often a small phase error.
Best,
Tom Danley
Tom Danley said:Hi CGL, Iain
....
Note both win-mls and Smart had nearly an identical phase error at the low end but had differing errors above. I have seen systems, which had amplitude errors as well.
....
That is EXACTLY why I pointed out the DC blocking. Both Smaart and WinMLS measures the phase correctly, my simulation doesn´t include the hipass as I dont really know where it is at.
I´m trying to attach a sim with a 1 st. order "DC-Blocking" at 15 Hz. I could measure it for real tomorrow.
Oh, by the way, the WinMLS sweep is a single ~1s. long sweep with the level after the DSP at about -90 dBV at 30 Hz. The level it self could cause some deviation...
Attachments
Hi
I see what you mean, if one added something like a first order high pass at say 20Hz, one would get a similar phase response.
If you do a direct cable loop back test, what frequency response do you measure then I wonder?. I mean can you measure to say 5 or 10Hz and "see" that high pass.
Best,
Tom
I see what you mean, if one added something like a first order high pass at say 20Hz, one would get a similar phase response.
If you do a direct cable loop back test, what frequency response do you measure then I wonder?. I mean can you measure to say 5 or 10Hz and "see" that high pass.
Best,
Tom
Tom Danley said:Hi
I see what you mean, if one added something like a first order high pass at say 20Hz, one would get a similar phase response.
If you do a direct cable loop back test, what frequency response do you measure then I wonder?. I mean can you measure to say 5 or 10Hz and "see" that high pass.
Best,
Tom
You mean the measurement system ?
Or the processor without added-filters ?
I´ll measure them both tomorrow.
Dear Tom,
I have progressed with my project:
http://people.qualcomm.com/kalousek/index.htm
to a point of cross-over attempts, initially with Behringer. (I still have some issues with the mid-frequency drivers response not measuring the same as the one of the "real" Unity, but I have done some simulation, and believe that I know how to correct it.)
Could you amplify about the "funny stuff", namely, how it manifests itself in measurements?
Thank you,
M
In building the Unity and Synergy horns, I found that having the drivers so close together that they added coherently also required the phases to be “right” or funny stuff happened.
I have progressed with my project:
http://people.qualcomm.com/kalousek/index.htm
to a point of cross-over attempts, initially with Behringer. (I still have some issues with the mid-frequency drivers response not measuring the same as the one of the "real" Unity, but I have done some simulation, and believe that I know how to correct it.)
Could you amplify about the "funny stuff", namely, how it manifests itself in measurements?
Thank you,
M
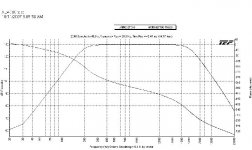
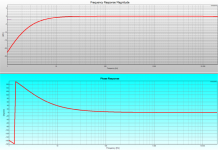
I promised some measurements.
It´s the DSP (latency removed).
The measurement system itself isn´t really interesting, two flat lines...
Notes:
1). The resolution is only 0.4 Hz as the sweep time was 2.5 s.
2). I was wrong, the hipass is an 2nd. order function at ~3.8 Hz with
a Q of ~0.62. Apologies for that.
3). There seems to be some 20 deg of phase shift at 20 Hz....
Attachments
Hi mefistoflez, CGL and John.
John said” The question is where is the AC? There is only one way to determine that, at least approximately: Assume the driver is minimum phase. This is generally true. I have not seen any conventional driver that is not minimum phase well into their stop band when measured on axis. Assuming this, then it is possible to construct the minimum phase response of the driver and determine how much delay must be removed form the native response to match the HBT result.”
I am not that familiar with that process but the TEF has a similar issue, on needs to know the total fixed delay (how far away is the origin) before measuring amplitude and phase.
Here the time is measured first . One uses a linear sweep at say 5000Hz per second from say 5K to 20KHz. The mic signal lags behind the source signal by the amount of time time delay, if it were 1130 feet away, it would be 5000Hz behind in this example.
Anyway, the mic and source are multiplied together (like in a radio) giving a sum and difference F.
The difference F is read on an FFT (4 second data accumulation period) which is re-scaled to reflect distance / time and one sets the cursor on the amplitude peak.
While this (the peak) is close to true zero time, that point (real zero) is too high in F and far down in amplitude to detect even with a white spectrum like a lin sweep.
In reality, to emulate the computer model which is at true zero time, one must set the Time on the tef a little ahead of the peak in the ETC measurement.
That ETC curve, energy time curve, is the total energy (log scale).
One can look at the Real part of that and see impulse response or the imaginary part (90 degrees way) the doublet response.
One can FFT the impulse but one needs to know time to get phase, but zero time is not at the peak of the impulse but on the rising slope of these as the system under test is band limited.
Anyway, that linear sweep difference F might be useful if you need to measure these delays.
Best,
Tom
CGL, that looks good, you found it! Cool.
One could plug in a compensating curve for that I would think.
Tom
Mefistofelez, the horn looks cool, much like the Yorkville Unity built under license.
Keep in mind that the highest F you can use the side mounted drivers to, is set by the quarter wave cancellation notch related to the distance to the throat horn apex.
Hope fully you can experiment with one before you drill the final holes one your cool one.
The drivers are acoustically coupled together, when you take your measurements, short out the range your not measuring. Because of that same coupling, they will make terrifically deep cancellation notches when the phases and amplitudes aren’t right.
When everything is right, they add like there is no crossover.
At the bottom is the first review of a current version.
Best,
Tom Danley
http://www.proaudioreview.com/pages/s.0037/t.8805.html
Dear Tom,
thank you very much for the reply.
This is a prototype. I have actually drilled different sized holes, in different distances from the apex, to see whether I can measure any differences. Unfortunately, my computer decided to die at the moment I started measuring. ;-) But a new one is on its way.
What do you mean by this? To measure only over the frequency range over which the drivers are supposed to operate?
I already had my "spy's" preview. I do not have to be convinced ever since I have heard the first Unity at John's (Hancock) place.
Sorry everyone about the OT post.
M
thank you very much for the reply.
Keep in mind that the highest F you can use the side mounted drivers to, is set by the quarter wave cancellation notch related to the distance to the throat horn apex.
This is a prototype. I have actually drilled different sized holes, in different distances from the apex, to see whether I can measure any differences. Unfortunately, my computer decided to die at the moment I started measuring. ;-) But a new one is on its way.
. . . when you take your measurements, short out the range your not measuring.
What do you mean by this? To measure only over the frequency range over which the drivers are supposed to operate?
At the bottom is the first review of a current version.
I already had my "spy's" preview. I do not have to be convinced ever since I have heard the first Unity at John's (Hancock) place.
Sorry everyone about the OT post.
M
If you are so concerned about low frequency phase shifts, you will be interested in seeing some differences between air core inductors and iron cored inductors.-CGL- said:I promised some measurements.
It´s the DSP (latency removed).
The measurement system itself isn´t really interesting, two flat lines...
Notes:
1). The resolution is only 0.4 Hz as the sweep time was 2.5 s.
2). I was wrong, the hipass is an 2nd. order function at ~3.8 Hz with
a Q of ~0.62. Apologies for that.
3). There seems to be some 20 deg of phase shift at 20 Hz....
soongsc said:
If you are so concerned about low frequency phase shifts, you will be interested in seeing some differences between air core inductors and iron cored inductors.
I´m not concerned about the phase shift, I measured it for Tom as he said there was errors in the previous graphs....
- Status
- This old topic is closed. If you want to reopen this topic, contact a moderator using the "Report Post" button.
- Home
- Loudspeakers
- Multi-Way
- Measuring Phase Response of Drivers