In the thread Dynamics in Loudspeakers Mr. Soongsc wrote interesting hypothesis that hysteresis (which?) is visible on initial curve of an IR thus we can look for a differences between soft and rigid pistons so that the curve shape is related with music details damping - very unusual idea. Measurements tell us it is not the case. You can try yourself but:
1) If you use direct IR measurement method then you can choose short or long stimulus pulse like 50us and 5000us. Where is a border between step and impulse response then? What about FFT spectra? In both cases?
2) Now assume that longer pulse is better because you put more energy and this means more SNR also. With 50us pulse the energy will be so small (I'm not able at the moment to perform such test). Next thing is that you must put microphone close to the transducer because of low SNR in this method. What about reflections?
Example - 6.5cm mic position and we have 5kHz resonances seen on appended IR. Soft dome should be well damped so is this a reflection or resonance? I'm not sure - Burst Decay shows something like reflection.
Best,
Jack
Attachments
Since we will never achieve a perfect step response nor perfect impulse response we must be able to tell which one is closer to the ideal if comparing several rsponses. And this might be quite tricky.
Which trace is the better response to the input step (blue) ?
Regards
Charles
Which trace is the better response to the input step (blue) ?
Regards
Charles
Attachments
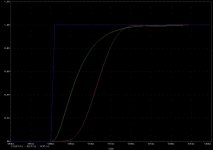
I'm going to speculate that the green is going to have better resolution, but will start being compressed earlier.phase_accurate said:Since we will never achieve a perfect step response nor perfect impulse response we must be able to tell which one is closer to the ideal if comparing several rsponses. And this might be quite tricky.
Which trace is the better response to the input step (blue) ?
Regards
Charles
I think one must consider that it is not necessarily difference between hard and soft dome, but rather how much revealing of detail the driver can produce which is a combination of motor and diaphram. What we should consider is that both listening and tests need to be conducted to verify the relationship, and we may find things that we have missed.jzagaja said:In the thread Dynamics in Loudspeakers Mr. Soongsc wrote interesting hypothesis that hysteresis (which?) is visible on initial curve of an IR thus we can look for a differences between soft and rigid pistons so that the curve shape is related with music details damping - very unusual idea. Measurements tell us it is not the case. You can try yourself but:
...
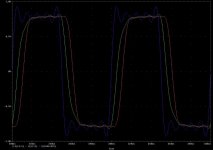
Before I comment I will post the response to a 10 kHz rectangular that is bandwidth limited to slightly below 100 kHz by a phase-linear brickwall response. So we will have first, third, fifth, seventh and nineth harmonics.
That approximates somehow a 192 ksamples/s reproduction chain like DVD-A.
Regards
That approximates somehow a 192 ksamples/s reproduction chain like DVD-A.
Regards
Attachments
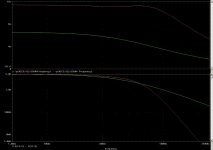
Below you see the group delay (upper plot) and the amplitude response (lower plot). You can see that the red trace has a steeper rolloff but much flatter group delay response within the interesting passband - at the cost of increased group delay.
The red rectangular trace from the former post looks much nicer than the green one IMO despite the bandwidth restrictions. My guess is that, if there is an audible difference, then the red one must be better. I also dare to say that amplifiers with exorbitantly high slew rates don't make any sense at all when they drive tweeters that go up to 40 kHz at best. Optimising group-delay within the passband might be superior to ridiculously fast amplifiers because it can correct timing errors within the audible range what the latter definitely can't - and it can be implemented at lower cost. And in this case another argument against class-d amps might become obsolete.
So my comments to the following statements:
Since this is a linear simulation using ideal components no compression will ever take place nor any other nonlinear distortion. This leads me to the conclusion that it is veeeeeeeery dificult to keep linear and non-linear effects apart in a visual inspection of a step-response.
Yes and no. The linear (i.e. "flat") range of the response is going higher but it is rolling off at a much steeper slope. Additionally the highest harmonics used in the "test-signal" are attenuated more than for "the green one". But still the red rectangular is much nicer IMO. This again shows how difficult it is to interpret a step response (and its influence on any "normal" signal) correctly.
Regards
Charles
The red rectangular trace from the former post looks much nicer than the green one IMO despite the bandwidth restrictions. My guess is that, if there is an audible difference, then the red one must be better. I also dare to say that amplifiers with exorbitantly high slew rates don't make any sense at all when they drive tweeters that go up to 40 kHz at best. Optimising group-delay within the passband might be superior to ridiculously fast amplifiers because it can correct timing errors within the audible range what the latter definitely can't - and it can be implemented at lower cost. And in this case another argument against class-d amps might become obsolete.
So my comments to the following statements:
I'm going to speculate that the green is going to have better resolution, but will start being compressed earlier.
Since this is a linear simulation using ideal components no compression will ever take place nor any other nonlinear distortion. This leads me to the conclusion that it is veeeeeeeery dificult to keep linear and non-linear effects apart in a visual inspection of a step-response.
I think red represents improved HF response.
Yes and no. The linear (i.e. "flat") range of the response is going higher but it is rolling off at a much steeper slope. Additionally the highest harmonics used in the "test-signal" are attenuated more than for "the green one". But still the red rectangular is much nicer IMO. This again shows how difficult it is to interpret a step response (and its influence on any "normal" signal) correctly.
Regards
Charles
Attachments
My impulse generators supply Bessel filter only so I have no influence on step shape.
Once I recorded 1KHz sawtooth with ATRAC compression I couldn't tell the difference
Despite SNR issues and step slopes does anyone knows pros and cons in comparison to nowadays MLS and sine sweep methods?
Once I recorded 1KHz sawtooth with ATRAC compression I couldn't tell the difference
Despite SNR issues and step slopes does anyone knows pros and cons in comparison to nowadays MLS and sine sweep methods?
Is this comment based on theoretical aspects only, or did you actually sit down and listen to the differences?phase_accurate said:Below you see the group delay (upper plot) and the amplitude response (lower plot). You can see that the red trace has a steeper rolloff but much flatter group delay response within the interesting passband - at the cost of increased group delay.
The red rectangular trace from the former post looks much nicer than the green one IMO despite the bandwidth restrictions. My guess is that, if there is an audible difference, then the red one must be better. I also dare to say that amplifiers with exorbitantly high slew rates don't make any sense at all when they drive tweeters that go up to 40 kHz at best. Optimising group-delay within the passband might be superior to ridiculously fast amplifiers because it can correct timing errors within the audible range what the latter definitely can't - and it can be implemented at lower cost. And in this case another argument against class-d amps might become obsolete.
So my comments to the following statements:
Since this is a linear simulation using ideal components no compression will ever take place nor any other nonlinear distortion. This leads me to the conclusion that it is veeeeeeeery dificult to keep linear and non-linear effects apart in a visual inspection of a step-response.
Yes and no. The linear (i.e. "flat") range of the response is going higher but it is rolling off at a much steeper slope. Additionally the highest harmonics used in the "test-signal" are attenuated more than for "the green one". But still the red rectangular is much nicer IMO. This again shows how difficult it is to interpret a step response (and its influence on any "normal" signal) correctly.
Regards
Charles
Is this comment based on theoretical aspects only, or did you actually sit down and listen to the differences?
I haven't done any listening experiments so far but I intend to do so one day. One problem is to measure the driver's response acurately in order to determine the necessary phase compensation.
Regards
Charles
Hmm, I'm contantly measuring and listening. Just trying to figure out what the potential of different drivers are and how they can be improved without re-inventing the wheel. The speaker group delay is never as smooth as electronics, so this is really out of control for the time being.
Can we talk for a moment about impulse response calculus from haevide step? I'm getting something like noise however another interesting thing is that FFT result is quite nonlinear much more than MLS and Sine Sweep tells. Well for my ear JXR6 is unbalanced so maybe short transient spectra differs or measurement is wrong.
Attachments
First of all: Both the step response and the amplitude response are good IMO.
Are you talking about noise problems when measuring a single single step in order to calculate pulse response and frequency response from it ?
Well SNR is exactly the reason why the use of MLS sequences (and averaging of multiples of them) was proposed in the first place !!!!
Regards
Charles
Are you talking about noise problems when measuring a single single step in order to calculate pulse response and frequency response from it ?
Well SNR is exactly the reason why the use of MLS sequences (and averaging of multiples of them) was proposed in the first place !!!!
Regards
Charles
Are you still using that USB scope? What are the specs on it? What amplifier is being used to drive the speaker-under-test?jzagaja said:Can we talk for a moment about impulse response calculus from haevide step? I'm getting something like noise however another interesting thing is that FFT result is quite nonlinear much more than MLS and Sine Sweep tells. Well for my ear JXR6 is unbalanced so maybe short transient spectra differs or measurement is wrong.
Please find oscilloscope spec. here. The amplituner is Pioneer SX-F21 that comes from micro hifi set (ca. 1996 Eisa Award). At the moment I don't have its measurement but the stimulus signal seen on the first picture comes from it.
Looks like I could use one of these, are they expensive?jzagaja said:Please find oscilloscope spec. here. The amplituner is Pioneer SX-F21 that comes from micro hifi set (ca. 1996 Eisa Award). At the moment I don't have its measurement but the stimulus signal seen on the first picture comes from it.
It looks like a good tool to monitor power supply voltage variation with music, just have to add a cap to avoid DC from getting in.jzagaja said:I paid something like 150 Euro on ebay used. For comparison high quality sound card Digigram VX line starts from 100 Euro. High quality pulse generator Paktek ca. 50 Euro.
But anyway, the impulse is really good to look at the detail possible driver cone design issues.
Here is a comparison between different stimulus signal. Short pulse (45us) rise time was limited by amplifier and I don't know why. Please notice that microphone has significant influence since I used 90deg placing and its thickness is 8mm. Heviside step looks reasonable however high frequencies double resonance is not resolved or shifted?
Attachments
- Status
- This old topic is closed. If you want to reopen this topic, contact a moderator using the "Report Post" button.
- Home
- Loudspeakers
- Multi-Way
- Direct Impulse Response measurements