I re-read the last page in this thread, and I would like make one more comment.
Yes, I do totally agree that CSD's are totally useless when designing a speaker system with a given set of drivers. Totally agree. They show me nothing that I can do anything about, really....
Frequency response linearity (at varying driving powers, not just small-signal) and designing the X-over to suit the powerhandling of the used drivers is in my opinion the first and foremost goals that the finished system should be designed to achieve, this goes for novice as well as expert designers. After that, polar response (beaming) and hence interdriver phase (lobing) should be taken into account as they very much affect the way the speaker interacts with reality - your listening room.
But when COMPARING otherwise similar drivers out of system, CSD's or indeed studying the raw impulse can show differences between drivers that a pure time-independant dataset like an FR completely, or less completely masks.
Another example:
A parasitary resonance in a driver that at first excitation soaks the energy at a given frequency region and then starts feeding this stored energy back to that frequency region later in the [Time] vector (it is excited out of phase - or more exactly put in counterphase to the exciting signal) can give an almost perfectly flat FR, even if the IR (or in this case, rather the step-response...) looks like a recording of a churchbell... Given that the [Time] window that the FR is synthesized from is just right, of course. Or wrong if you choose to take that view.
This is not an unknown phenomenon. I do believe this WILL show up in the Harmonic Distortion plots, but I don't know how to analyze what the problem with this driver is from just looking at the FR and the HD plots. The information will be well hidden, and with too many unknown factors.
(If things were really simple, all THD-plots could be accurately synthesized from the data of LINEAR deviations of the drivesystem (mechanical and electrical) and the resonant behaviour of the driver. This is not very true. Any driver resonance has varying impact on HD, and it varies with factors unknown to me, at least... If someone here knows, please tel me.)
On a CSD plot this problem will be very visible as first a deep valley in the [Time]-sliced plot, followed by a slowly dropping ridge in the same frequency region.
Of course - inversely this also means that I think that choosing a driver with a reasonably flat FR both in and a bit out of its chosen passband in the system AND having low HD in the same FR region will most certainly rule out most of those offenders.")
But I still think that choosing a driver with lower energy storage (faster energy/time decay) over a driver with the same FR, but with a bit lower THD can be a good choice. I prefer transient cleanness to absolute harmonic cleanness. This is indeed personal.
And before someone shouts "impossible!", it is indeed very possible to find two drivers meeting these criteria. As far as I have seen proved anywhere, there is no absolute linear relation between resonances, HD and FR. This coupling could only be valid if time is not allowed to exist as a variable.
In my view of the world, [Time] exists, and is actually quite important.
Yes, I do totally agree that CSD's are totally useless when designing a speaker system with a given set of drivers. Totally agree. They show me nothing that I can do anything about, really....
Frequency response linearity (at varying driving powers, not just small-signal) and designing the X-over to suit the powerhandling of the used drivers is in my opinion the first and foremost goals that the finished system should be designed to achieve, this goes for novice as well as expert designers. After that, polar response (beaming) and hence interdriver phase (lobing) should be taken into account as they very much affect the way the speaker interacts with reality - your listening room.
But when COMPARING otherwise similar drivers out of system, CSD's or indeed studying the raw impulse can show differences between drivers that a pure time-independant dataset like an FR completely, or less completely masks.
Another example:
A parasitary resonance in a driver that at first excitation soaks the energy at a given frequency region and then starts feeding this stored energy back to that frequency region later in the [Time] vector (it is excited out of phase - or more exactly put in counterphase to the exciting signal) can give an almost perfectly flat FR, even if the IR (or in this case, rather the step-response...) looks like a recording of a churchbell... Given that the [Time] window that the FR is synthesized from is just right, of course. Or wrong if you choose to take that view.
This is not an unknown phenomenon. I do believe this WILL show up in the Harmonic Distortion plots, but I don't know how to analyze what the problem with this driver is from just looking at the FR and the HD plots. The information will be well hidden, and with too many unknown factors.
(If things were really simple, all THD-plots could be accurately synthesized from the data of LINEAR deviations of the drivesystem (mechanical and electrical) and the resonant behaviour of the driver. This is not very true. Any driver resonance has varying impact on HD, and it varies with factors unknown to me, at least... If someone here knows, please tel me.)
On a CSD plot this problem will be very visible as first a deep valley in the [Time]-sliced plot, followed by a slowly dropping ridge in the same frequency region.
Of course - inversely this also means that I think that choosing a driver with a reasonably flat FR both in and a bit out of its chosen passband in the system AND having low HD in the same FR region will most certainly rule out most of those offenders.
But I still think that choosing a driver with lower energy storage (faster energy/time decay) over a driver with the same FR, but with a bit lower THD can be a good choice. I prefer transient cleanness to absolute harmonic cleanness. This is indeed personal.
And before someone shouts "impossible!", it is indeed very possible to find two drivers meeting these criteria. As far as I have seen proved anywhere, there is no absolute linear relation between resonances, HD and FR. This coupling could only be valid if time is not allowed to exist as a variable.
In my view of the world, [Time] exists, and is actually quite important.
theSuede said:
In my view of the world, [Time] exists, and is actually quite important.
You may want to do some research on minimum phase linear systems, Hilbert Transform phase reconstruction, and whether or not drivers are safe to be considered minimum phase or not with some exception cases.
A few short and quick excerpts from wikipedia:
Minimum phase
.....
"Minimum phase in the time domain
For all causal and stable systems that have the same magnitude response, the minimum phase system has its energy concentrated near the start of the impulse response. i.e., it minimizes the following function which we can think of as the delay of energy in the impulse response"
....
"Minimum phase as minimum group delay
For all causal and stable systems that have the same magnitude response, the minimum phase system has the minimum group delay. So, the proper term should be a minimum group delay system --- it's just that minimum phase has been assigned in the literature so the name stuck. The following proof illustrates this idea of minimum group delay"
In other words, (in my words), if two minimum phase system has same magnitude response (amplitude part of FR), they will have the same phase response and same impulse response, and therefore same CSD, burst tone etc.
If you look at that wikipedia page the definition of "minimum phase" system includes the system to be linear. And drivers are safe to be considered minimum phase, both in terms of their relationship between amplitude and phase responses, and the level of nonlinearity they poses. The reason for it that, they can be satisfactorily equalized out (if complex enough equalizer is availabel) which yields also good impulse response and time domain behaviour.
Nonlinearity of a driver is in of itself a problem, it sounds not clean. The way it shows itself in CSD's, FR's or correction with xovers are secondary.
And a small note also for some earlier remark, a ringing of a metal cone doesn't automatically indicate nonlinearity, nor the ringing of a bell does. A bell, or any other musical instrument that is excited by a striking, makes a sound with lots of harmonics mostly because its FR has many high Q resonances that are spaced at harmonics, due to the nature of the instrument. The strike is like an impulse, the resultant sound is the impulse response (i.e. time domain of its FR). Since it has high Q amplitude resonances at certain frequencies, and since a strike is reach in its spectrum, the device filters out most frequencies, and leaves and resonates at certain frequencies that are harmonics. This is different than the harmonic generation with nonlinearity. The bell, or the instrument may and most probably does nonlinearities also, but the main mechanism I believe that generates its certain sound spectrum is not just nonlinearity, and mostly its FR. Just as the metal cones.
This said - I have to agree that MOST OF THE TIME, most of the energy-storage in a driver CAN be roughly estimated by looking at the FR. But this will be an educated guess, not a truth. Most of the time, this will be enough, but....
Lets simplify. What you are saying is you do not believe that drivers are minimum phase.
Let me explain the concepts in my own words.. If a minimum phase driver had no energy storage, it would have a flat frequency response. Or, to state it differently, frequency response variations in a minimum phase driver exist because there is energy storage. Since several papers have been cited in this thread from AES that all drivers are minimum phase, with the exception of drivers with a whizzer. I consider this as scientifically accepted fact. It may or may not be correct, but the burden of proof at this point is on disproving minimum phase theory.
Soundeasy, for example, derives both frequency response and CSD from an impulse response. Since both of these are not directly measured, but derived, a perfect inverse function will reproduce the original.
I want to echo that I have learned something from the discussion.
For that, I would like to thank all the participants (or combatants?)
Doug
theSuede said:
Another example:
A parasitary resonance in a driver that at first excitation soaks the energy at a given frequency region and then starts feeding this stored energy back to that frequency region later in the [Time] vector (it is excited out of phase - or more exactly put in counterphase to the exciting signal) can give an almost perfectly flat FR, even if the IR (or in this case, rather the step-response...) looks like a recording of a churchbell... Given that the [Time] window that the FR is synthesized from is just right, of course. Or wrong if you choose to take that view.
This is not an unknown phenomenon. I do believe this WILL show up in the Harmonic Distortion plots, but I don't know how to analyze what the problem with this driver is from just looking at the FR and the HD plots. The information will be well hidden, and with too many unknown factors.
...........
......
On a CSD plot this problem will be very visible as first a deep valley in the [Time]-sliced plot, followed by a slowly dropping ridge in the same frequency region.
What you are describing, if I understood correctly, is actually nothing to do with nonlinearity (and so Harmonic distortion), and it is in the amplitude FR plots already when driver is minimum phase. Which for many times had been shown to be safe to consider them to be minimum phase.
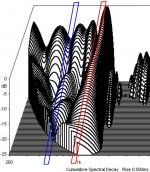
I wasn't going to go into this detail originally, but looks like I will. First what does really CSD show? Most people are looking at its horizontal slices, since the computer spits out horizontal slices, and the descriptions of how the algorithm generates it tells that it is a repetitive frequency responses (the horizontal slices) with increasing start time of the impulse response window. What most don't know and ignore, is that CSD is meant to show the time decay envelope of the system on an infinitely going on sinus response that is suddenly ceased. And this is meant to be corresponding to the vertical slices of the CSD. For instance the vertical slice at frequency = 1Khz on a CSD , is a calculated envelope of the time response of the system when it had been fed with a 1Khz pure tone, and at time =0 the tone is stopped. That 1Khz vertical slice shows the envelope of the decay. So, that is the starting point of CSD, and that is what is it supposed to show and looked at. The horizontal slices seems to take more "press"
I think because it is easier to generate the 3-D data by generating the horizontal slices rather than the vertical slices. So in that light, and using one of the CSD's posted earlier in this thread, which I took a section of it and posted below, I will try to show how "parasitic resonances" occur, and why they are already in the FR as problem regions when driver is minimum phase.
These often are the result of deep notches in the frequency response. At the attached picture (if I got it to attach correctly), I tried to mark to vertical slices as example. First the one at around 500Hz, there is a dip, and dip goes deeper, and then it comes back as a ridge. The second one is there is a severe and narrow dip at 900Hz, again it is initially a dip valley, then starts to come back and becomes a ridge. Note these are both related to FR shape, they just become a ridge later, but both are related to dips in the FR. And the narrower the dip the more pronounced this initial dip and then ridge occurs.
Let's look at the 900Hz vertical slice and try to explain what is going on. As I said above the vertical slice is supposed to give the decay envelope. So looking at the 900Hz, the driver has been excited with 900Hz pure tone for a long time, and at time = 0 it is stopped. First just as time = 0, the amplitude of the driver output by definition is its value at amplitude FR, since the signal had been applied for a long time, it is the steady state amplitude of the response to 900Hz. And before time=0, the signal was pure 900Hz, since it was a long going (infinite) 900Hz tone. But just after t=0, signal is stopped. What is that signal? It is no longer a pure 900Hz tone. If it was it would still be playing till plus infinity at 900Hz. Because the signal is stopped, now new tones are present in the signal besides the 900Hz. And when we look at the FR of the input signal (which is an ongoing but then stopped 900Hz signal), its spectrum contains components not only at 900Hz, but a lot of others around 900hz, which decrease in amplitude as moving away from 900Hz. That all means when the signal stopped at time = 0, the rest of the response of the driver (the decay response) will be mostly determined by the FR by the close neighboring region around 900Hz. And that is why the narrower the dip, the more this valley and peak shows up in the CSDs. As I said the input signal contains sine componentts populated around 900Hz. The one at 900Hz cause a small output because there is a dip at its FR, but the neighboring ones don't because their FR amplitude is higher than 900Hz. As a result the decay envelope shows up like that. Nothingn to do with harmonic distortion or nonminimum phase behavior, all can be explained and demonstratable with linear and minimum phase behavior.
And the important part is, the bad behavior that shows up in the CSD, is easily traceable to the amplitude FR plot, to narrow dips. As much as a sharp peak is indication of time domain problem, a narrow dip is also. Any deviation from a smooth flat amplitude FR results in problem in time domain.
Attachments
is that CSD is meant to show the time decay envelope of the system on an infinitely going on sinus response that is suddenly ceased
Quoting myself
Since I went into detail, I will reiterate something I had been said a few times in this thread. The CSD is the calculated decay responses at different frequencies. In order to calculate a response to a signal, one convolve's the input signal with impulse response. The result will be the correct output only if the system was linear. So if nonlinearity is a problem that breaks the relationship between FR and CSD of drivers to dismiss that relationship, the CSD itself should be dismissed, because it is calculated with the assumption that driver is linear.
Hey guys, still having fun with this one?
I still read this one and laugh every time:
That was great!
This was kind of funny too:
For one, he just took two different drivers with a similar energy storage within a given range and showed them before and after a crossover is applied. He simply showed how the stored energy was still the same in a given region. Nothing new there.
What is really funny is how he contradicted his earlier comments about how useless a CSD was. To illustrate the stored energy of the two drivers he used a CSD. If what he said was really true about the uselessness of the CSD then why didn't he illustrate the stored energy differences by showing a frequency response? He claims he can see the stored energy in the frequency response but still uses CSD? How funny is that?
Here are the CSD of the frequency responses that I posted earlier. These are the ones everyone was afraid to comment on and no doubt now will get responses about contamination of the measurements, blah, blah, blah. Can't trust his measurements...
First they could read the stored energy in the frequency response, but after it was posted they wanted to see an impulse response and one guy even asked me if I could e-mail the file to them so that they could see the CSD and then comment on it. How funny is that? Put them to the test and they want to see the answer first.
Anyway, see if the stored energy is where you thought it was or if the magnitude of the stored energy is what you thought. Some were pretty obvious but still no comments were made.
Here were the two questions asked:
1) In each graph what area has the greatest amount of stored energy?
2) Of the three graphs which woofer as the greatest amount of stored energy and where?
Say whatever you want to now. It doesn't matter. The results were just as predicted. No comments were made.
I still read this one and laugh every time:
4. The mathematical conversion from f(Amplitude)of(Frequency) to f(Amplitude)of(Time) is made (step no. 3. is reversed). This is what some people here claim they can do - in their heads. []
That was great!
This was kind of funny too:
Without getting drawn into the debate and instead just giving some acknowledgement for an interesting thread. I think John sums up much of what has been said in this thread with illustrative graphs and concise, easy to understand text. This can be found on his blog page here:
For one, he just took two different drivers with a similar energy storage within a given range and showed them before and after a crossover is applied. He simply showed how the stored energy was still the same in a given region. Nothing new there.
What is really funny is how he contradicted his earlier comments about how useless a CSD was. To illustrate the stored energy of the two drivers he used a CSD. If what he said was really true about the uselessness of the CSD then why didn't he illustrate the stored energy differences by showing a frequency response? He claims he can see the stored energy in the frequency response but still uses CSD? How funny is that?
Here are the CSD of the frequency responses that I posted earlier. These are the ones everyone was afraid to comment on and no doubt now will get responses about contamination of the measurements, blah, blah, blah. Can't trust his measurements...
First they could read the stored energy in the frequency response, but after it was posted they wanted to see an impulse response and one guy even asked me if I could e-mail the file to them so that they could see the CSD and then comment on it. How funny is that? Put them to the test and they want to see the answer first.
Anyway, see if the stored energy is where you thought it was or if the magnitude of the stored energy is what you thought. Some were pretty obvious but still no comments were made.
Here were the two questions asked:
1) In each graph what area has the greatest amount of stored energy?
2) Of the three graphs which woofer as the greatest amount of stored energy and where?
An externally hosted image should be here but it was not working when we last tested it.
An externally hosted image should be here but it was not working when we last tested it.
An externally hosted image should be here but it was not working when we last tested it.
An externally hosted image should be here but it was not working when we last tested it.
An externally hosted image should be here but it was not working when we last tested it.
An externally hosted image should be here but it was not working when we last tested it.
Say whatever you want to now. It doesn't matter. The results were just as predicted. No comments were made.
Uh, Danny, perhaps you should read post 53...
I pretty much summarized correctly how the energy storage would look. In fact, my analysis is better since the energy storage below 1k is not clearly defined on the CSD's. And you might want to examine Feyz's comments relating FR and CSD.
Anyway, I'm done too. Again everyone, read the posts and judge for yourself. Look at Danny's curves-look at where the FR irregularities are and look where the energy storage is. Really, it's right there.
bye for now...
Originally posted by Danny What is really funny is how he contradicted his earlier comments about how useless a CSD was. To illustrate the stored energy of the two drivers he used a CSD. If what he said was really true about the uselessness of the CSD then why didn't he illustrate the stored energy differences by showing a frequency response? He claims he can see the stored energy in the frequency response but still uses CSD? How funny is that?
John used a CSD to show that the drivers are virtually identical after the XO transfer function is applied and this despite having rather different FR's. The whole point was to show the irrelevance of the CSD in this case. I thought he made a good point.
I really don't have time to engage in a debate Danny. I came here learned something, thanked the contributors and then intended to leave my contribution at that.
With the history between you and John I have to say your at risk of becoming synonymous with that very thing instead of the sterling work you do with your designs, at least in DIY circles anyway. Do like John does, contribute and then leave it at that. Lets not turn this into a 100 page epic that chases its own tail.
You think John is wrong and you've put across your POV. Everyone has read that. Don't retread old ground persistantly posting the same information. I think there's enough information here for anyone to make an informed decision.
Hi Danny,
It seems from your post #127 that to an ignorant novice like me,
1. violent changes in frequency response shows stored energy that one can see in the CSD. For example - when the FR is smooth, the CSD drops away quite quckly. When there is a zig-zag, there is stored energy issues one can then expect to see in the CSD.
2. Even if the FR is smooth - lower down in frequency, there is more stored energy anyway probably because the larger the excursion, the motor or enclosure will have less and less (as you go down in frequency) ability to stop movement, hence output artifacts you would expect to see in a CSD for any woofer.
Your examples have been excellent and have helped me visualise a CSD from the FR alone. Don't get me wrong - I doubt I could predict precise msec the ringing would stop and how severe, but when properly attenuated in a crossover, the resulting CSD must be down also.
I am not trying to continue a debate. I also don't mind people telling me I am wrong. A person that claims they are wrong less than 50% of their life is deceiving themself
Cheers,
David.
Uh, Danny, perhaps you should read post 53...I pretty much summarized correctly how the energy storage would look.
Ah, no not really. For one, you didn't attempt to answer either of the posted questions.
This one (below) was good. It was rather obvious and I hoped someone would at least catch that part.
The red and blue curves have the best energy storage below 1k.
But then you basically said the same thing about the green one too.
The green will have energy storage issues below 1k
And you obviously missed that one.
The sharpest thing you said was this:
Second, a nearfield measurement, while helpful below 1k, has to be interpreted very carefully above 1k due to the interference nulls that will occur that aren't really there.
This was very correct and this issue is clearly present on two of the curves.
Your buddy Zaph noticed this when he measured our M-130 woofer several years ago and had no idea what it was. He even posted it on the Madison board asking about it. Even after I told him what it was he still posted on his site that the driver had a suck out at 1,900Hz.
John used a CSD to show that the drivers are virtually identical after the XO transfer function is applied and this despite having rather different FR's. The whole point was to show the irrelevance of the CSD in this case. I thought he made a good point.
Yea, but he took two drivers that had almost the same energy storage in that range.
What if the metal cone driver would have looked like this one?
Even if the crossover were steep enough to get rid of some or most of the break up in the upper end, it would still have quite a bit of stored energy below 3kHz where it would be used. You also wouldn't know from this drivers frequency response that it had excessive stored energy below 5kHz.
It seems from your post #127 that to an ignorant novice like me,
That would not be the case.
1. violent changes in frequency response shows stored energy that one can see in the CSD... When there is a zig-zag, there is stored energy issues one can then expect to see in the CSD.
Sure, sometimes it is really easy to see. The point in posting those easy to discern examples was just to try and get a response from those that were so confident in reading a CSD from a frequency response. No one attempted to answered the simple questions.
For example - when the FR is smooth, the CSD drops away quite quckly.
Not necessarily. See the example posting just above in this response.
Keep in mind though that driver with a large amount of mass playing to the same level as one with a lighter weight mass can have just as smooth of a response but more stored energy than the driver with the lighter weight mass. You won't see this in the frequency response either.
Hi Danny,
The green does have energy storage issues below 1k. You don't understand the math and thus, because it's not obvious in the waterfall, it's not there. But it's there in the FR. That's the whole point, which again, you remain ignorant of.
I stand by my analysis of the curves. It in fact, is somewhat more insightful than just blinding looking at the CSD's.
Spend a little more time reading Fourier theory.

I said I wouldn't bring myself into the debate but I can't help myself...
That makes sense. I agree.
I certainly cannot calculate and visualise in my head the CSD from the FR. I can guess, but don't know what it would be like exactly without applying the math for a minimum phase device.
I agree with Danny on that point.
However, I agree with all others, that if a CSD can be mathematically derived from an FR curve, then one should tell you the other. But - you have to be able to run the math to generate. You can't just visualise in your head.I think that is what Danny is pressing for here.... and for that I agree.
One thing I've learned about Zaph's comments like anyone experienced in a field is he specifies the result / conclusion. As a newbie you have to understand their is a reason or logic behind that conclusion. To explain would involve describing all the theory which would take no small amount of time. Zaph often states things that people might take in an inflammatory way. I like the way he specifies a "black or white" view..... (says me sitting on the fence
one thing for sure - both views have enlightened my understanding and learnning in this area. I appreciate the time and explanations Mark, Zaph, Danny, Dave (and others) have contributed.
David.
For example - when the FR is smooth, the CSD drops away quite quckly.
Not necessarily. See the example posting just above in this response.
Keep in mind though that driver with a large amount of mass playing to the same level as one with a lighter weight mass can have just as smooth of a response but more stored energy than the driver with the lighter weight mass. You won't see this in the frequency response either.
That makes sense. I agree.
I certainly cannot calculate and visualise in my head the CSD from the FR. I can guess, but don't know what it would be like exactly without applying the math for a minimum phase device.
I agree with Danny on that point.
However, I agree with all others, that if a CSD can be mathematically derived from an FR curve, then one should tell you the other. But - you have to be able to run the math to generate. You can't just visualise in your head.I think that is what Danny is pressing for here.... and for that I agree.
One thing I've learned about Zaph's comments like anyone experienced in a field is he specifies the result / conclusion. As a newbie you have to understand their is a reason or logic behind that conclusion. To explain would involve describing all the theory which would take no small amount of time. Zaph often states things that people might take in an inflammatory way. I like the way he specifies a "black or white" view..... (says me sitting on the fence
one thing for sure - both views have enlightened my understanding and learnning in this area. I appreciate the time and explanations Mark, Zaph, Danny, Dave (and others) have contributed.
David.
Re: Minimum phase
Result of the narrow deep notch and not necessarily an indication of nonminimum phase behaviour, already explained here:
http://www.diyaudio.com/forums/showthread.php?postid=1273682#post1273682
Since you brought up, notice the original smoothed FR curves for those didn't show those narrow notches. But they would out of mysterry would show as ringing on the CSD's, and then a claim could have been made that "see nothing relating to FR but the CSD shows the ringing" if the unsmoothed FR plots weren't requested here And seeing (or foreseeing) this, why would anyone answer to a challenge which the question was ambigious to start with: which driver has most energy storage. How do you quantify energy storage of a driver. You can't do it without reference to frequency, because it is not just about time to decay, it is about how many osciallations it takes to decay. Response diminishing after 5 oscillations at 200Hz has same stored energy problem as response diminishing after 5 oscillations at 2Khz, but one takes 25 msecs, the other 2.5msecs.
kstrain said:It is hard to see without a phase plot (which is unecessary if the system is minimum phase) but is the "Blue curve" in Danny's examples above minimum phase at the zero(s) near1.8kHz?
Result of the narrow deep notch and not necessarily an indication of nonminimum phase behaviour, already explained here:
http://www.diyaudio.com/forums/showthread.php?postid=1273682#post1273682
Since you brought up, notice the original smoothed FR curves for those didn't show those narrow notches. But they would out of mysterry would show as ringing on the CSD's, and then a claim could have been made that "see nothing relating to FR but the CSD shows the ringing" if the unsmoothed FR plots weren't requested here
And seeing (or foreseeing) this, why would anyone answer to a challenge which the question was ambigious to start with: which driver has most energy storage. How do you quantify energy storage of a driver. You can't do it without reference to frequency, because it is not just about time to decay, it is about how many osciallations it takes to decay. Response diminishing after 5 oscillations at 200Hz has same stored energy problem as response diminishing after 5 oscillations at 2Khz, but one takes 25 msecs, the other 2.5msecs.What determines "excessive" stored energy? That is my point in the above paraghraph in this post. Your point of quantifying energy storage is different from mine, and from probably others here. Why would anyone answer your challenge, when your interpretation of the answer will be different, or suspect of your interpretation? And also I have posted twice on this thread before that that driver's FR is not so smooth below 5Khz, and it is no suprise that CSD will show up like that below 5Khz.]Originally posted by DannyYou also wouldn't know from this drivers frequency response that it had excessive stored energy below 5kHz.
That is my point in the above paraghraph in this post. Your point of quantifying energy storage is different from mine, and from probably others here. Why would anyone answer your challenge, when your interpretation of the answer will be different, or suspect of your interpretation?
You are correct. I purposefully used a question with a subjective answer. Not to catch or trick anyone. That wasn't the point. Reading the stored energy from the frequency response alone is subjective. In some cases a guess at best. By simply asking "how much" it allows one to use their own measure and not mine.
I am surprised Mark took a shoot at it. I really didn't think anyone would respond. Some of these are guys are just trying to win an argument, are more afraid of being wrong, and wouldn't take a shoot at it even if the differences were really obvious and easy. My example using two 8" woofers were about as different as two woofers could get, and still nothing.
I think this thread has run its coarse. Several mentioned learning something from this thread so maybe some good has come of it all. People can make their own minds as to the usefulness of a CSD. Thanks to all that participated. I do have a lot of respect for many of the contributors even those that were combative with me. Good stuff here from Pete, Feyz, theSuede, Mark, Dave, and others. See ya.
- Status
- This old topic is closed. If you want to reopen this topic, contact a moderator using the "Report Post" button.
- Home
- Loudspeakers
- Multi-Way
- Curious about ZAPH's designs. Seas L18 and P18RNXP