I suspect the other problems will EQ out
Erm..
 but not too bad to begin with.
This plot was taken using a crossover simmed in exo, as introduced last month by mabat in this thread, for those interested.
Attachments
AllenB
Its good to see data that looks real. When I look at plots of others that are done in ARTA they look so smoothed as to not be realistic. This one looks like what I see when I do the measurements. It confirms my suspicions that people smooth the data until it looks good and then post that.
As to making waveguides, its not as simple as just drawing some lines on paper and then making a solid model of it, cutting a mold and you are done. I've been making these for more than 20 years and its taken a while to get it right. I suspect that people are going to be somewhat disappointed with the fancy looking devices that are now being made with "new concepts". What is being missed is that these concepts aren't new they have been tried before and they don't work very well (or we would have seen them in the marketplace). And even after you get the waveguide right, there is a lot more to the problem to get the system right.
AllenB
Its good to see data that looks real. When I look at plots of others that are done in ARTA they look so smoothed as to not be realistic. This one looks like what I see when I do the measurements. It confirms my suspicions that people smooth the data until it looks good and then post that.
As to making waveguides, its not as simple as just drawing some lines on paper and then making a solid model of it, cutting a mold and you are done. I've been making these for more than 20 years and its taken a while to get it right. I suspect that people are going to be somewhat disappointed with the fancy looking devices that are now being made with "new concepts". What is being missed is that these concepts aren't new they have been tried before and they don't work very well (or we would have seen them in the marketplace). And even after you get the waveguide right, there is a lot more to the problem to get the system right.
Could you be more specific about what measurements had smoothing? All measurements Zilch posted didn't have smoothing.
I also wonder what you mean by "new concepts". The only major waveguide project I know of is the SEOS-15 design and its measurements are looking impressive.The SEOS-15 if anything will be the "OS Waveguide" that is available to all DIYers and it should be under $100 per waveguide. Sure some XO expertise is needed but some people do have great resources and your 20 Years has allowed others to shorten up the prototyping to production in < 1 year....thanks!
I remember asking why an OS waveguide cost so much, now I know the truth
Last edited:
OK, first attempt at a serious crossover on this set.
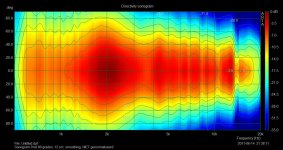
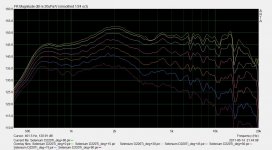
I ran a power response out to 60 degrees and crossed that flat (the lower of the two in the first attachment). It uses E12 values, 3 woofer components, 12 tweeter components, and the plots are not valid below 500Hz.
Two concerns so far. The vertical lobes are within +/- 3 degrees of the listening position at and above the crossover point, but below the crossover point it veers toward 12 degrees downward by the time the tweeter is 12dB down. Has it been suggested this would be within acceptable limits?
Secondly, 20 degrees off axis (upper of the two plots in the first attachment) doesn't look too good to listen on, I may end up crossing flat on this axis instead.
Attachments
Could you be more specific about what measurements had smoothing? All measurements Zilch posted didn't have smoothing.
Of course they did. It should be right in the legend what it was 1/3 or 1/6 or what have you.
Rob
ARTA applies a minimum of 1/12 oct. smoothing to the sonogram plots.
Despite the recent popularity of sonograms I still prefer to see response curves with a minimum of smoothing. It might bit more difficult to get a general idea of the directivity of a driver, but there is simply more information in the seperate curves that gets lost in the sonogram. I usually generate both the frequency response curves from 0 degrees up to usually 90 degrees in one plot, as well as the sonograms - both normalized and not normalized.
Despite the recent popularity of sonograms I still prefer to see response curves with a minimum of smoothing. It might bit more difficult to get a general idea of the directivity of a driver, but there is simply more information in the seperate curves that gets lost in the sonogram. I usually generate both the frequency response curves from 0 degrees up to usually 90 degrees in one plot, as well as the sonograms - both normalized and not normalized.
but there is simply more information in the seperate curves that gets lost in the sonogram.
I seriously believe the opposite. The polar map ("sonograph" is not the correct term since this defines a spectrum versus ttime NOT spectrum versus angle) is harder to get used to, but shows all the data at a glance. Things like resonances and diffraction become obvious when you know what you are looking for, that are simply not easily identified in individual curves.
Maybe it depends on the software used to generate the plots. This is what I get with ARTA. Would you post some pictures for comparison?
Attachments
ARTA applies a minimum of 1/12 oct. smoothing to the sonogram plots.
Once you gate, there really isn't much to lose.
Neither of the first two plots below have any smoothing whatsoever. The first is gated within a reflection free zone and the second is not. The third plot overlays the gated response without smoothing and 1/12 octave smoothed.
Attachments
I didn't mean to sound direct I believe you said that some data gets lost in ARTA when polar plotted.
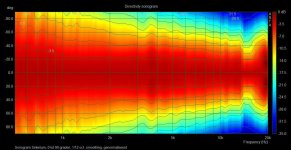
If you look at the plot I posted the other day (post 5364) it looks more distinct, but it has darker contour lines. It wasn't plotted with ARTA but the data was taken with ARTA and I smoothed it 1/12 octave on the way out to prepare it for crossover work. Hoping this provides some insight.
I believe you said that some data gets lost in ARTA when polar plotted.If you look at the plot I posted the other day (post 5364) it looks more distinct, but it has darker contour lines. It wasn't plotted with ARTA but the data was taken with ARTA and I smoothed it 1/12 octave on the way out to prepare it for crossover work. Hoping this provides some insight.
Maybe it depends on the software used to generate the plots. This is what I get with ARTA. Would you post some pictures for comparison?
Quite odd that there is good resolution in the angular direction, but not in the frequency direction. In general this should be the opposite.
There are many polar maps at my website GedLee LLC. Even an interactive program that you can run.
is there somewhere an easy to understand guid how to make the OSWG for 1" Compressiondrivers? maybe an Excel sheet that have be approved to be correct for the calculation. Also one that is easy to understand to use.
There's a waveguide group buy going on right now from Poland and they have the OSWG-12 for $120. Fiberglass with a mirror finished gelcoat. They look really nice. I think they had 6 colors you could get, maybe 7, I can't recall right now.
Not sure if that helps at all. But it's in the group buy section.
The same company did the prototype for the SEOS-15 which was designed as a group effort by some waveguide pros much smarter than I am.
I don't know a lot about waveguides. But it was neat to see the SEOS test better than all the others. It's amazing what can be done with some group effort. The DIY community has a lot of smart people in it, that's for sure.
is there somewhere an easy to understand guid how to make the OSWG for 1" Compressiondrivers? maybe an Excel sheet that have be approved to be correct for the calculation. Also one that is easy to understand to use.
Go back to the roots:
Here John Kreskovsky provided the (pretty simple) geometry / math to the oblate speroid contour / curve, where Earl did fail :
Ed
This math is tricky, but it can be done with a cut and try approach.
Unfortunately this doesn't quite do it. Thats because when you simply shave off the end, when the angle is correct the throat radius is no longer correct. You have to find a new throat radius and offset such that when the angle is correct the radius is also correct. I doubt that Excel has a simple function for this. It took me a couple of pages of math to get it right.
I've been following this and the "Beyond" thread.
….
Anyway, I put together an OS wave guide spread sheet that will accept throat radius, throat angle and exit angle and compute the correct profile and locate the X offset. That is, at the X offset the slope matches the input angle and the throat radius. You can down load it here: http://www.musicanddesign.com/codes/OS_wave_guide.zip
Michael
Last edited:
is there somewhere an easy to understand guid how to make the OSWG for 1" Compressiondrivers? maybe an Excel sheet that have be approved to be correct for the calculation. Also one that is easy to understand to use.
Hi Hylle,
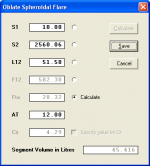
The Horn Segment Wizard in Hornresp can be used to design an oblate spheroidal waveguide. Horn dimensions can then be exported as required.
The calculations are correct
.Kind regards,
David
Attachments
Thanks, now i just have to figure out what alle the numbers means. I will also consider buying a waveguid.
Where can you see something about shape and performance of that 15" waveguid.
You should consider the OS waveguides offered out of Poland. Best I have seen anywhere!
- Home
- Loudspeakers
- Multi-Way
- Geddes on Waveguides