Don't you want to gate the data and avoid room influence?
The many time frequency plots shown here together with whats been the troubles at the beginning in identifying the root cause should make at least one thing clear:
As much as a wavelet analysis - or one of the other TF-plots - is a detailled map of the sonic pattern at the mic position - it simply does not tell us whats to exclude from that chart as "being room interaction only"

the point here is that looking for example at the 2.5ms slot with two regions overlapping in time which are most likely from the driver itself (2kHz) as well as from the cabinet (400Hz) or even a little bit from the room .
Hence we need to learn to read the map - which for many may be more difficult in "GPS age".
This involves some effort but is way more rewarding than a simple route description from A to B
Finally - to exclude "save and secure" all room interaction from the plot we possibly best do that prior to measurement (move outdoor)
Michael
Last edited:
I would still like to see the frequency response with the start of the window moved as shown here (pink line):
An externally hosted image should be here but it was not working when we last tested it.
I was referring to the REW spectrogram. The wavelett transform already windows out the spectrum and different times, doesn't it. So we do see the problem area at 2.5ms which is centered around 2kHz. In this case, actually the impulse shape is a more clearer indication. There are also more interesting modes associated with a large driver like this. But for a low frequency application, the solution of using a filter is quite clear, lowpass as low as you can.The many time frequency plots shown here together with whats been the troubles at the beginning in identifying the root cause should make at least one thing clear:
As much as a wavelet analysis - or one of the other TF-plots - is a detailled map of the sonic pattern at the mic position - it simply does not tell us whats to exclude from that chart as "being room interaction only"

the point here is that looking for example at the 2.5ms slot with two regions overlapping in time which are most likely from the driver itself (2kHz) as well as from the cabinet (400Hz) or even a little bit from the room .
Hence we need to learn to read the map - which for many may be more difficult in "GPS age".
This involves some effort but is way more rewarding than a simple route description from A to B
Finally - to exclude "save and secure" all room interaction from the plot we possibly best do that prior to measurement (move outdoor)
Michael
But for a low frequency application, the solution of using a filter is quite clear, lowpass as low as you can.
True, if cleaning up the measurement to the maximum degree is the sole objective...
Sheldon
The interesting part with that AE speaker is that t showed us that gating at a specific time is not always a good idea due to the overlap of frequency regions in time that are or are not accessible.
Also the measurements at hand show us that *if* we are too rigor, we would have to cut well below 400Hz which would make that approach completely useless for a mid-speaker.
So - as always - its a compromise and dealing with trade off''s - but to have measurements and plots available allows us to do head on comparison further on.
Yes, in this manner wavelet analysis is the same as any time versus frequency plots shown here, and also similar to CSD.
Wavelet just offers some advantage in handling IMO due to flexible focusing at aspects of special interest.
Michael
Also the measurements at hand show us that *if* we are too rigor, we would have to cut well below 400Hz which would make that approach completely useless for a mid-speaker.
So - as always - its a compromise and dealing with trade off''s - but to have measurements and plots available allows us to do head on comparison further on.
The wavelett transform already windows out the spectrum and different times, doesn't it.
Yes, in this manner wavelet analysis is the same as any time versus frequency plots shown here, and also similar to CSD.
Wavelet just offers some advantage in handling IMO due to flexible focusing at aspects of special interest.
Michael
Last edited:
What is the wavelet software Michael and where can it be obtained?
Its a piece of software that I knocked together to support the idea of wavelet analysis in DIY audio.
Credits go to Elias Pekonen and Jean-Michel Le Clac'h which were the main contributors - not to forget Jacques Lewalle who gave allowance to use his code freely.
The details can be found in the two wavelet threads and many exampel analisis in the horn honk thread.
Its free for download and any constructive input or coding work is highly welcomed.
Analysing time versus frequency at high time resolution comes in handy everytime when distinct delay time effects enter the picture – like with any sort of reflections.
version 1.4 download :
http://www.diyaudio.com/forums/soft...wavelet-analysis-available-2.html#post2172102
Do these plots have any relationship to the waterfall response graphs, by any chance? (old dogs, new tricks, etc!)
Yes its basically the same idea behind – wavelet analysis compared to CSD just gives more detailled insight IMO
So – its definitely an old dog *with* (relatively) new tricks.
Don't miss the show !
LOL
Does this mean the plots have to be normalized to produce a wavelet with your software?
Dan
Not exactly – you can do however you like with wavelet – in fact the software plots both pictures :
normalized and non-normalized (just in case of...)
Michael
Last edited:
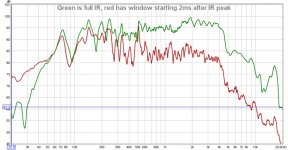
Good suggestion. Here's an example that compares the spectra of the direct arrival vs all of the indirect arrivals (room reflections). In other words, the lower curve has been windowed to exclude the first 2 milliseconds, but remain open for 1000 milliseconds afterwards.
That is an interesting graph, but I am confused about a couple of things. I would have thought that the energy from the "reverberation" would have been lower especially at the higher frequencies where the wavelengths are so short.
There would be two reasons of course. The path is longer for the reverberation, so there would be a 3dB to 6dB drop off every time the distance is doubled (depending on frequency and room geometry). Second, at higher requencies, the wavelengths are too short to effectively diffract around objects and are also easily absorbed/scattered by various objects and boundaries (depending how large and "soft" they are).
So that got me thinking. What exactly is plotted on the Y-axis? Is it something like power or is it something like energy (power multiplied by time). In that case, the direct sound may have lots of power but it would be integrated over such a short period of time (hence little energy). If this were true, then the "reverberation" is in a sense elevated because of its "longer integration window" (which of course is necessary since this is what is being measured).
Also, I am not sure what a 2 msec window "means" at low frequencies, where the signal period is less than the 2 ms window (freqeuncies below 500 Hz). Technically, if it is a measure of power, then it needs to be measured over the signal's period.
Thoughts about my confusion?
Last edited:
Don't you want to gate the data and avoid room influence?
Of course ideally, the data is gated but look at the impulse and tell me where the first room reflection point is. The first spectrograms I posted had a 3 ms gate, the newer one 6 ms(I think that's what Michael's using). You an tell in the first ones that there's a minimum of room interference if any, the later look like a different situation.
Dan
The time resolution with wavelet analysis is independently scalable and does not depend to the length of the whole plot, meaning, it does not matter if we analyze (and show) a 6ms or a 60ms measurement or eternity - the plots would all look the same for a given time slot.
Michael
Michael
Last edited:
Wow, you guys have really made some great contributions and given me a great learning opportunity! Thanks to the amazing graphical analysis tools excellent explanations, I'm beginning to make sense a lot of things that I have been previously exposed to but not really understood.
Many thanks to all of you!
I'm finally at the assembly stage with the HF horn supports. More glue-up this afternoon, and painting the grill frames for the woofer cabinets. I'll take more pictures when there's something worth looking at.
Gary Dahl
Many thanks to all of you!
I'm finally at the assembly stage with the HF horn supports. More glue-up this afternoon, and painting the grill frames for the woofer cabinets. I'll take more pictures when there's something worth looking at.
Gary Dahl
Come on Gary, quit building and get back to theorising with the rest of us!
Seriously though, great contributions by all over the last several days - signs of progress on all fronts.
I've just downloaded the new REW V5 Beta measurement software from Home Theatre Shack: Getting Started with REW
Looks good so far. Any comments?
Seriously though, great contributions by all over the last several days - signs of progress on all fronts.
I've just downloaded the new REW V5 Beta measurement software from Home Theatre Shack: Getting Started with REW
Looks good so far. Any comments?
If there is enough high frequency absorption, then the room relfection is not as evident looking at the impulse, that is why the person doing the measurement better know where his first reflection is going to come from and estimate the gate This is also the reason I stopped using additional absorption material when I measure in an everage room, so that I can see the location of the first reflection easier.Of course ideally, the data is gated but look at the impulse and tell me where the first room reflection point is....
Dan
Wavelett transform is a valuable tool to help access how hifidelity the system is because you can do a wavelett transform on any input music, then do a wavelett transform of the output. If you can make these two match like fingerprint matching, then you have a pretty good playback.
If there is enough high frequency absorption, then the room relfection is not as evident looking at the impulse, that is why the person doing the measurement better know where his first reflection is going to come from and estimate the gate This is also the reason I stopped using additional absorption material when I measure in an everage room, so that I can see the location of the first reflection easier.
((((SNIP))))
Now that I have the spectrogram, I may go back to damping. I will still measure one undamped just get a clear view of where the gate should be.
Dan
I don't have examples of the wavelett thing for display yet, if that's what you are asking for. But you can use a fixed window size throughout the file. The thing that would be convenient is to add a pulse at the beginning of the music as a sync indicator. Run wavelett transform for the original file, the run the wavelett on the file recorded by the mic. The comparision time frame will be pretty long compared to running wavelett on the impulse.Soongsc, can you post an example of this? Even a bad example would be OK.
For the absorption thing.
blown up x16.
Attachments
I would still like to see the frequency response with the start of the window moved as shown here (pink line):
An externally hosted image should be here but it was not working when we last tested it.
I think someone posted that earlier, but here it is (1/24 octave smoothing):
View attachment 182692
John, any conclusions or theories to share ?
Michael
Sorry Michael, no special insights from me, I just happened to have the IR WAV files as part of something else I'm looking at, haven't really been following the substance of the thread.John, any conclusions or theories to share ?
John, any conclusions or theories to share ?
Michael
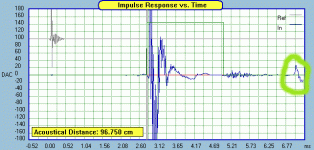
Just the obvious. It seems to agree with what George was saying about damping the room and reflections. It really isn't obvious to me, by looking at the impulse, that this is a driver resonance, an inverted pulse indicating diffraction as the origin, or a reflection for which the high frequency content has been absorbed. The FR plots shows that there is significant attenuation of the high frequency content.
But the problem is that there is just too much room "noise" in the data to separate out what's really going on in the first 4 or 5 msec. Like I said, I'd like to see the FR with a a 5 or 6 msec window and then move the first mark to 2.5 msec so the window was shortened to 2.5 to 3.5 msec. I don't use Arta so I can not process the impulse on my own. (Demo of Arta won't allow importing the impulse file.)
Like I said, I'd like to see the FR with a a 5 or 6 msec window and then move the first mark to 2.5 msec so the window was shortened to 2.5 to 3.5 msec. I don't use Arta so I can not process the impulse on my own. (Demo of Arta won't allow importing the impulse file.)
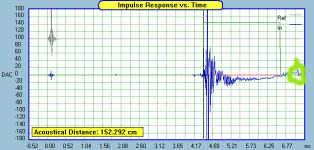
Ok - got it:
Full dampening


Less dampening


Zero dampening


(You are in urgent need to add a *.wav import feature to SE
Michael
Last edited:
- Home
- Loudspeakers
- Multi-Way
- Beyond the Ariel


