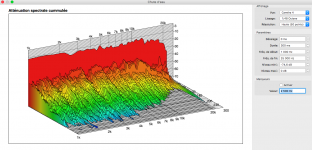
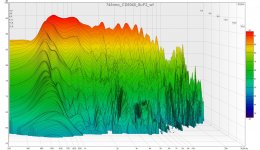
Here are some measurements I made earlier this year with Fuzzmeasure of two samples of the Be driver, measured at the mouth of the Azurahorn.
Unlike the curve shown above, these have the high pass filter No. 28 shared earlier in this thread applied. What I believe is diaphragm breakup is visible with 1/48 octave smoothing (it is not with 1/12 smoothing) and appears to occur above 20 kHz. If I understand correctly the longer decay there is caused by energy storage in the diaphragm itself that continues to be released even after the stimulus is removed.
Anybody can comment on the level of this breakup? I don't have anything to compare.
Regards - Pierre
Attachments
Last edited:
Think real world it can be complicated but if measured absolute phase follows minimum phase values the longer decay should react and corrected out if correction curve is the exactly reverse curve, if reverse correction happens not repair decay but only amplitude maybe problem is storage in diagraph or reverse curve is not absolute right, if measured absolute phase don't follow minimum phase values the longer decay could maybe be corrected using FIR filters and DSP engine running up at 96kHz or more.
Thanks for the plots. That looks very well behaved to me, at least at that time scale. I can't imagine how that little resonance above 20K could ever be audible.
What I don't understand is the abrupt drop in level from time 0 to the beginning of the decay. What is it, like 30db? then the resonances trail off normally from there. Is that the horn and not the driver? Maybe a zoom in on the Z axis would show more.
What I don't understand is the abrupt drop in level from time 0 to the beginning of the decay. What is it, like 30db? then the resonances trail off normally from there. Is that the horn and not the driver? Maybe a zoom in on the Z axis would show more.
Thanks for the plots. That looks very well behaved to me, at least at that time scale. I can't imagine how that little resonance above 20K could ever be audible.
What I don't understand is the abrupt drop in level from time 0 to the beginning of the decay. What is it, like 30db? then the resonances trail off normally from there. Is that the horn and not the driver? Maybe a zoom in on the Z axis would show more.
Resonance above 20K is quite audible for a driver. That is what I discovered in the process of solving an annoying sound when listening to Domingo’s singing. Fast decay in the first 0.4ms or so is what I had mentioned a long time ago. You get much cleaner sound by suppressing the remaking sound from past music.
An impulse wav should be very short, thus a small file. I wonder if REW is padding the beginning and end? If so, it should Zip much smaller.
EDIT. Just checked an export of a horn mesurement. Wav file was 256K, and zips down to 155K. That's not a problem. What are you getting?
EDIT. Just checked an export of a horn mesurement. Wav file was 256K, and zips down to 155K. That's not a problem. What are you getting?
if Pierre is wiling to repeat a comparable measurement here with only one 8.2uF series capacitor and microfon just at the mouth of the horn in the middle.
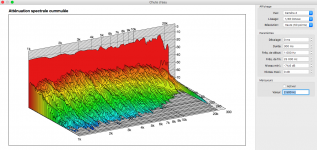
Certainly! I used REW this time, and guessed your settings the best I could to ease comparison between our plots. So using just a 8.2uF cap in series with the driver, and measuring at the mouth of the horn, this is the Be diaphragm...
Attachments
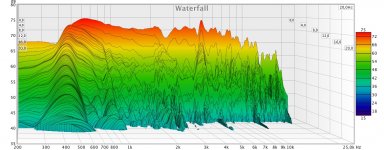
Certainly! I used REW this time, and guessed your settings the best I could to ease comparison between our plots. So using just a 8.2uF cap in series with the driver, and measuring at the mouth of the horn, this is the Be diaphragm...
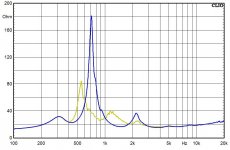
Looks more smooth for me. But the hole around 2khz is strange. Do you habe the Impedanz curve of the driver mounted to your Horn and could post it here? My current test Horn changes the free air peak in this region quite well.
 .
.CSD settling time... Sub 1 ms
I have never measured a compression driver but I would have thought it should be sub 1 ms?
The attached is a CSD plot of a Rapid Energy Decay (RED) driver I have developed and its sub 1 ms.
Cheers
Derek.
you should be looking at 10-20 ms not 300 ms
I have never measured a compression driver but I would have thought it should be sub 1 ms?
The attached is a CSD plot of a Rapid Energy Decay (RED) driver I have developed and its sub 1 ms.
Cheers
Derek.
Attachments
- Home
- Loudspeakers
- Multi-Way
- Beyond the Ariel