I think R1 should probably be a 5W resistor. With the amount of attenuation you're looking for, everything else can be 1/2 watt or less. For 2 mW into 8 ohms, you're looking to deliver about 22 mA peak current!With my 2w amp, I can use small components and probably add a bypass switch!
Chris
")
Sorry about the delayed reply, had a couple of long and exhausting days there.
-Gnobuddy
Kevin O'Connor says:
"Speaker attenuators are notorious for sounding "buzzy" at high attenuations. Most speaker attenuators alter the tone before they reach 8dB reduction. The key to*Power Scaling*is that it is applied to the power output tube stage itself, and so comes*before*the output transformer.*Power Scaling*allows a dynamic power range of 40dB. What must be accomplished is to keep the "transfer curve" of the amplifier the same. The transfer curve is simply the relationship between the input and output signals. Power Scaling*is the best solution for those players who incorporate some amount of output stage "effect" in their sound. This effect can be some clipping, heavy clipping, or just that cusp of compression you get in a tube power amp approaching clipping.*Power Scaling*allows you to live at that cusp or beyond, but at ANY loudness you need.
"Speaker attenuators are notorious for sounding "buzzy" at high attenuations. Most speaker attenuators alter the tone before they reach 8dB reduction. The key to*Power Scaling*is that it is applied to the power output tube stage itself, and so comes*before*the output transformer.*Power Scaling*allows a dynamic power range of 40dB. What must be accomplished is to keep the "transfer curve" of the amplifier the same. The transfer curve is simply the relationship between the input and output signals. Power Scaling*is the best solution for those players who incorporate some amount of output stage "effect" in their sound. This effect can be some clipping, heavy clipping, or just that cusp of compression you get in a tube power amp approaching clipping.*Power Scaling*allows you to live at that cusp or beyond, but at ANY loudness you need.
Kevin O'Connor says:
The key to*Power Scaling*is that it is applied to the power output tube stage itself, and so comes*before*the output transformer.
But I want the output transformer to saturate. That's half the fun!
Chris
One thing puzzles me about O'Connor's "power scaling" and Dana Hall's "VVR", and various other more-or-less similar approaches. All of them lower the screen grid voltage on the output pentodes, and some may also lower the anode voltage, the preamp B+, output stage fixed-bias voltage, et cetera.Kevin O'Connor says:
<big snip>
What must be accomplished is to keep the "transfer curve" of the amplifier the same. The transfer curve is simply the relationship between the input and output signals.
When you lower the DC bias voltage on a pentode, all the curves drop down, closer to the Ia = 0 x-axis of the graph. This includes the Vgs = 0 curve, the topmost one on most of the output valves we use for guitar amps.
Now, the transformer primary impedance doesn't change - so the load line stays in exactly the same place, no matter what you do with your VVR or "power scaling" or what-have-you. But the tube curves do drop lower.
This means that a key aspect of output tube distortion sound - the relationship between the load-line, and the "knee" of the curves in the top left corner - will necessarily change.
Most guitar amps are set up with the load line passing "below the knee" of the output valve curves. When you drop the screen grid voltage, the "knee" drops closer to the x-axis, and, at some point, the load line will pass "above the knee" rather than below it.
This is quite significant in terms of distorted sound: if the load line is "above the knee", pentodes distort similarly to triodes, mostly creating a splash of second-harmonic distortion. But if the load line passes "below the knee", the tonal character changes, and larger amounts of third harmonic distortion are generated.
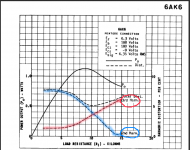
You can see this effect in the 6AK6 (2.7 watt beam power tetrode) curves I'm attaching. Notice how the 2nd harmonic distortion is high for small load resistances - i.e., when the load line passes "above the knee" - and low for large load resistances, when the load line passes "below the knee". I've highlighted this curve in blue.
Notice also how the 3rd harmonic distortion does exactly the opposite. It's low when load resistance is low ("above the knee"), and high when load resistance is high ("below the knee"). I highlighted this one in red.
The same thing happens to all pentodes and beam tetrodes when you change the load line's relationship to the "knee of the curves", but it's rarely displayed on the data sheet, as it is in the case of the 6AK6.
Full disclosure, I've never used any type of VVR or "power scaling" circuit. But, for the reason I just explained, I cannot see how they can "keep the transfer curve of the amplifier the same", as Kevin O'Connor claimed.
I am open to the possibility that power scaling might work better than an attenuator, sure. But it still doesn't keep the transfer curve of the amp the same. Nor does it keep the transfer curve of the human ear the same (Fletcher-Munson curves).
-Gnobuddy
Attachments
I generally take a lot of what Kevin O'Conner says with more than a grain of salt. However, I've used a VVR on several amps, and found it to work extremely well. I found it usually sounded best if you only scaled the power amp and PI rail voltages. If you scaled the whole amp's B+, it could start sounding a little squishy when turned down low.
Proof the pudding.
Proof the pudding.
Last edited:
Thanks for the feedback, I'll definitely try it out one of these days.<snip>
I've used a VVR on several amps, and found it to work extremely well. I found it usually sounded best if you only scaled the power amp and PI rail voltages.
The power supply I designed for my little 2W amp starts with a 48 VAC Hammond transformer, and from that generates multiple DC output rails, at roughly 110V, 165V, 220V, and 275V. Right now, the output valves run off the 220V rail (they're wee little 6AK6 radio output beam tetrodes, and cannot cope with the 275V rail - that one's there to feed any 12AX7's that show up in future preamp designs.)
So I could get a taste of the VVR experience by just adding a 1-pole, 3-way switch, which would let me switch the B+ to the power and PI stages to any of the first three values - 110V, 165V, 220V. That's so easy to do that I'll definitely have to try it out!
-Gnobuddy
Hmmmm....seems that would work for a cathode-biased amp. But if it is a fixed-bias amp, wouldn't you have to readjust the bias for every plate voltage selection?So I could get a taste of the VVR experience by just adding a 1-pole, 3-way switch, which would let me switch the B+ to the power and PI stages to any of the first three values - 110V, 165V, 220V. That's so easy to do that I'll definitely have to try it out!-Gnobuddy
My little 2-watter happens to be cathode biased, so no worries there.Hmmmm....seems that would work for a cathode-biased amp.
I think that was one of Kevin O'Connors contributions - a tracking voltage regulator that scales grid (fixed) bias voltage in the proper proportion to anode voltage.But if it is a fixed-bias amp, wouldn't you have to readjust the bias for every plate voltage selection?
Most pentode and beam tetrode plate curves are pretty flat over most of the voltage range. As long as the anode voltage wasn't dialed down really low, I would think they would work okay without scaling Vgk to match Va. Just a guess.
Looking at an old Tung Sol 6V6g datasheet, the anode current at Vgs = (-20 V) stays nearly constant at about 20 mA from Va = 400V all the way down to Va = 250V. Below that it droops down slightly, reaching 15 mA at about Va = 120V.
So only a relatively minor drop in Ia, from 20 mA to 15 mA, if the anode voltage was scaled from 400 V all the way down to 120 V. That's a 25% change in quiescent current, sure, but given that there is probably 20% variation between production pentodes anyway, I'm not sure this is big enough to be an issue.
Reducing the anode voltage by a roughly 3:1 ratio like that should, if pentodes were ideal, produce about a tenfold (20 dB) power reduction. So I guess if you wanted to drop the power even more than that, it would be necessary to scale Vgk. I think Kevin O'Connor was claiming "watts to milliwatts" or something like that, for his power scaling designs.
-Gnobuddy
KOC, the arrogant and abrasive, states that his Power Scaling achieves 44db of power reduction. That's pretty impressive. Your typical 40 to 50 watt guitar amplifier with a ~95 db sensitive speaker would need at least 30 db of reduction to be "bedroom" level. HotPlates offer ~ 20db reduction. With a small ~2 watt amplifier, I would think 20 db would be sufficient. One interesting feature of the HotPlate is that the load it presents to the amplifier includes a fan motor, which adds inductance (like a speaker does).Reducing the anode voltage by a roughly 3:1 ratio like that should, if pentodes were ideal, produce about a tenfold (20 dB) power reduction. So I guess if you wanted to drop the power even more than that, it would be necessary to scale Vgk. I think Kevin O'Connor was claiming "watts to milliwatts" or something like that, for his power scaling designs. Gnobuddy
> One thing puzzles me ...lower the screen grid voltage, the anode voltage...... ..... when the load line passes "below the knee".
Argument poorly founded. The graph does not change Vp or Vg2, only RL. It is a very indirect (and mis-interpreted) approach to what you want to know.
Your graph shows that for a *given* V and I, there is an optimum load, and mis-optimums both sides. You can run the same load at lower V and I and get very nearly the same (non)linearity.
> the load line stays in exactly the same place
No. If Vp is reduced, the loadline moves left. Invariably we also reduce Vg2 also, and if we also adjust Vg1 for a reasonable bias current, it moves down.
I started to plot a 6L6, but push-pull is too complicated, and the 6L6GC is such a "hot" tube that any happy SE loadline, with Vg2 near Vp, falls "below the knee" no matter what voltage you apply.
Plot it yourself. Do like KoC does: vary Vp and Vg2 together. Self-bias will adjust its own idle current; fix-bias needs bias reduction to keep up a happy current. You will find the loadline cuts the curves very similarly at any sane voltage, just smaller.
Or build it and 'scope it. On a 560V SE amp I was able to drop Vg2 by a factor of 4 or so with very little change in near-overload and past-overload bentness. This is over 16:1 range of power (my 16W would do 1W about the same). I did not explore the very-low power range much (this project was for studio, not apartment).
For a non-changing load, we might expect V and I to go down in the same proportion. They don't, and can't. Working from V, I comes from Child's Law and I goes down faster than V. For "maximum power" we would increase the load impedance at low V. However when not on "10", we are not asking for max power from a given voltage, we are looking for a "good" power and not real interested what the voltage is.
> Nor does it keep the transfer curve of the human ear the same (Fletcher-Munson curves).
Too-too true, unfortunately.
The answer is a small box enclosing the player, so s/he can play at 105dB SPL while the neighbor gets <<70dB.
Attachments
I woke up at 3:40 AM last night with that realization. Much of what I wrote in post #44 is wrong as a result of that mistake on my part.If Vp is reduced, the loadline moves left.
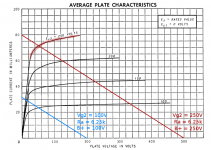
Today I dug up a datasheet for a power pentode that showed plate curves for a number of different screen grid voltages. Then I plotted a couple of loadlines with the same slope, but different Va (keeping Vg2 = Va in each case).
The result is attached. Sure enough, the load line doesn't shift very much in relation to the "knee" as the voltage is dropped. (Actually Vg2 = 100V and Va = 78V works better than both Vg2 and Va = 100V, but keeping them both the same is simpler, and "close enough".)
I did not / do not have the benefit of knowing what Kevin O'Connor did; his books are too rich for my blood (and my wallet.)
-Gnobuddy
Attachments
"First proposed by Clement D. Child in 1911, Child's Law states that the space-charge limited current (SCLC) in a plane-parallel vacuum diode varies directly as the three-halves power of the anode voltage Va and inversely as the square of the distance d separating the cathode and the anode." https://en.wikipedia.org/wiki/Space_charge
I woke up at 3:40 AM last night with that realization. Much of what I wrote in post #44 is wrong as a result of that mistake on my part.
Today I dug up a datasheet for a power pentode that showed plate curves for a number of different screen grid voltages. Then I plotted a couple of loadlines with the same slope, but different Va (keeping Vg2 = Va in each case).
The result is attached. Sure enough, the load line doesn't shift very much in relation to the "knee" as the voltage is dropped. (Actually Vg2 = 100V and Va = 78V works better than both Vg2 and Va = 100V, but keeping them both the same is simpler, and "close enough".)
I did not / do not have the benefit of knowing what Kevin O'Connor did; his books are too rich for my blood (and my wallet.)
-Gnobuddy
Keep in mind that with a typical guitar amp's power supply, varying the main B+ rail voltage, changes both Va and Vg2 by the same amount. You do however have to add an extra node for the preamp' +ve rail, so it doesn't sound over-compressed and fizzy. As I said before, the result is extremely good, so much so, that after being tested by recording studios and professional musicians, it ended up being used in commercial amp designs now available on the market.
As for KoC's books, from what I've seen of them, there is a fair amount of debatable material in them, accompanied by hand-scrawled schematic excerpts.
That's exactly what I did in one of the two graphs I attached - plotted two load lines, at very different Va, but with Vg2=Va in both cases. The load line is in nearly the same place wrt the "knee" of the curve in both cases, supporting the point you made, that VVR works very well, and does a pretty good job of preserving output stage "tone"....with a typical guitar amp's power supply, varying the main B+ rail voltage, changes both Va and Vg2 by the same amount.
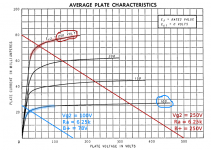
Since it's easy to try things on paper, I made a second plot, very similar, except that this time I moved Va to the best possible voltage to preserve the load line's position through the knee of the curves. And it turns out that when Vg2 = 100 V, the anode voltage should ideally be a bit lower than that, around 82 V. In other words, at least for this particular output valve, the VVR should ideally drop the anode voltage a little bit more than it drops the screen grid voltage.
But "close enough" is often the best way to go with engineering designs. The original VVR concept is almost stone-simple to anyone with a little familiarity with analogue electronics, and the little thought experiment I did with those two graphs suggests that VVRs should work very well, exactly as you've been saying.
The graphs I drew don't involve a preamp at all, they only show what the output valve does in response to a VVR.
If we had a full set of curves for each value of Vg2, we could also estimate how much drive signal the output stage would need (Vg1) for full output. This would potentially tell us something about how much to scale the power supply voltage to the phase splitter or driver stage.
Unfortunately for us, the (valve) manufacturer only gave us one single curve - the Vgk=0 one - for each of those different values of Vg2. So we can't proceed any further.
And most output valve data sheets I looked at have even less data, only showing curves for one single value of Vg2. Utterly useless for studying VVR behaviour.
I've never seen any of the books, but I'm deeply skeptical of anything or anyone that claims to be the "ultimate" answer to anything.As for KoC's books, from what I've seen of them, there is a fair amount of debatable material in them, accompanied by hand-scrawled schematic excerpts.
Real science and real engineering never has an "ultimate" answer. Reality is that we learn as we go, sometimes slowly. And I've found that the term "ultimate" is most frequently used by cult members, confidence tricksters, and advertising managers hoping to trick you into buying their products.
-Gnobuddy
- Status
- This old topic is closed. If you want to reopen this topic, contact a moderator using the "Report Post" button.
- Home
- Live Sound
- Instruments and Amps
- Resistive attenuator: -10db for guitar amps