 Recent OT posts have been removed, please limit the discussions to the GB. Thank you for your cooperation.
Hello Everyone,
In the below two previous postings I have provided URL links to independent reviews of Virtins Technology’s Multi-Instruments (MI) software.
- Posting # 135 GB for Virtins MI Pro for RTX6001 autoranging/autoscaling & for soundcard end users - Page 14 - diyAudio
- Posting # 149 GB for Virtins MI Pro for RTX6001 autoranging/autoscaling & for soundcard end users - Page 15 - diyAudio
The Editor-in-chief of AudioXpress magazine (Joao Martins) followed through on his promise to me per my posting # 149 and today uploaded Stuart Yaniger’s full review of MI, (please see the link to the full MI review in his email to me below).
When you read Stuart’s excellently written review of MI, I think one should bear in mind my prior posting # 69 GB for Virtins MI Pro for RTX6001 autoranging/autoscaling & for soundcard end users - Page 7 - diyAudio (particularly the portion of my earlier posting an the URL link there, i.e., “The Idea Behind Scripts”).
Additionally it is important to note that Stuart’s review was written / published in March 2016 on an older version of MI before such worthwhile nonlinear distortion measurement capabilities were added as a free upgrade to MI Pro, e.g., Dr. Earl Geddes’ GedLee Metric (Gm distortion) and non-coherent distortion (NCD). No other audio analyzer in the world, to include even Audio Precision, measures both Gm distortion and NCD.
I wish to express my heartfelt thanks to Mr. Joao Martins of AudioXpress Magazine for posting the above full review of MI online.
V/R,
MI Pro
-----Original Message-----
From: Joao Martins <j.martins@audioxpress.com>
To: MI Pro <mi_pro@aol.com>
Sent: Tue, Jun 19, 2018 4:46 am
Subject: Re: Requesting permission to post AudioXpress March 2016 review by Stuart Yaniger of Virtins Multi-Instruments software
Hi MI Pro,
As promised, we have posted the Multi.instrument review on the website.
Practical Test & Measurement: The Virtins Multi-Instrument Software | audioXpress
This will be featured in The Audio Voice newsletter this week.
Feel free to share it (including my email")
Meanwhile, Stuart is already looking at an update of the article, which we might publish on the magazine or just online.
Warmest regards
J. Martins
Editor-in-chief
www.audioxpress.com
https://www.facebook.com/audioXpresseditor
https://twitter.com/audioXP_editor
https://instagram.com/audioxpress
In the below two previous postings I have provided URL links to independent reviews of Virtins Technology’s Multi-Instruments (MI) software.
- Posting # 135 GB for Virtins MI Pro for RTX6001 autoranging/autoscaling & for soundcard end users - Page 14 - diyAudio
- Posting # 149 GB for Virtins MI Pro for RTX6001 autoranging/autoscaling & for soundcard end users - Page 15 - diyAudio
The Editor-in-chief of AudioXpress magazine (Joao Martins) followed through on his promise to me per my posting # 149 and today uploaded Stuart Yaniger’s full review of MI, (please see the link to the full MI review in his email to me below).
When you read Stuart’s excellently written review of MI, I think one should bear in mind my prior posting # 69 GB for Virtins MI Pro for RTX6001 autoranging/autoscaling & for soundcard end users - Page 7 - diyAudio (particularly the portion of my earlier posting an the URL link there, i.e., “The Idea Behind Scripts”).
Additionally it is important to note that Stuart’s review was written / published in March 2016 on an older version of MI before such worthwhile nonlinear distortion measurement capabilities were added as a free upgrade to MI Pro, e.g., Dr. Earl Geddes’ GedLee Metric (Gm distortion) and non-coherent distortion (NCD). No other audio analyzer in the world, to include even Audio Precision, measures both Gm distortion and NCD.
I wish to express my heartfelt thanks to Mr. Joao Martins of AudioXpress Magazine for posting the above full review of MI online.
V/R,
MI Pro
-----Original Message-----
From: Joao Martins <j.martins@audioxpress.com>
To: MI Pro <mi_pro@aol.com>
Sent: Tue, Jun 19, 2018 4:46 am
Subject: Re: Requesting permission to post AudioXpress March 2016 review by Stuart Yaniger of Virtins Multi-Instruments software
Hi MI Pro,
As promised, we have posted the Multi.instrument review on the website.
Practical Test & Measurement: The Virtins Multi-Instrument Software | audioXpress
This will be featured in The Audio Voice newsletter this week.
Feel free to share it (including my email
Meanwhile, Stuart is already looking at an update of the article, which we might publish on the magazine or just online.
Warmest regards
J. Martins
Editor-in-chief
www.audioxpress.com
https://www.facebook.com/audioXpresseditor
https://twitter.com/audioXP_editor
https://instagram.com/audioxpress
Here is an example of software loopback. The CSD plot did not have enough scaling range to show lower level effects, so I used the wavelet plot on the right. As we can see, this is clearly not ideal. It is not clear why this is, but it would be good to have the capability to gradually isolate.Can you provide a bit more detail? Maybe an example?
The different version of the software generating the CSD plot would generate more artifacts visible in the impulse as well. I am just demonstrating the clean version as an example.
Attachments
Second set of questions:
1. Can we generate a tolerance envelope for frequency response and distortion (and other measurements perhaps) from a golden model.
2. If yes for 1, is it possible to collect measurements from a collection of DUTs to see if they fall in the tolerance envelope, and flag units that do not?
3. If yes for 2, does this data collection need to be collected in a single test session, or can data be added as additional DUTs of the same are tested.
4. Can we compare measurements and generate difference plots?
Last edited:
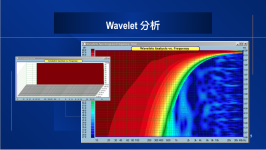
Here is an example of software loopback. The CSD plot did not have enough scaling range to show lower level effects, so I used the wavelet plot on the right. As we can see, this is clearly not ideal. It is not clear why this is, but it would be good to have the capability to gradually isolate.
The CSD plot looks perfectly ok to me. However, I can't read the numbers on the y-axis, so I can't compare to the wavelet plot. I am not sure what the wavelet analysis does, but I guess the issue you are referring to is the hash/noise in the blue area -- correct? Is the wavelet analysis really comparable to the CSD?
The different version of the software generating the CSD plot would generate more artifacts visible in the impulse as well. I am just demonstrating the clean version as an example.
Ok, if the same data gives different CSDs, something has changed with the software. You could ask the programmers if/how they changed the software. Note that this assumes you compared CSDs / wavelet plots using THE SAME data, not the same measurement setup to measure things once with the version X and again with version Y, which will give different noise residuals, and hence different hash on the CSD or wavelet plot.
Can you export the impulse response data and upload here so that we can look at it and make CSD or other plots from it using different software?
I have talked with the developer, he is aware of the changes and looking for a better solution. It seems that for this particular case, MLS signals generate a DC offset which results in some artifacts. I would suggest programmers look at their own programs and generate results first so that some comparison can be made.
The scale on the CSD goes from 100db to 50db and the wavelet goes down to 20db if I recall correctly. Yes, the light blue in the dark blue background are some artifacts, some of which seem to have some repeating pattern over time.
The scale on the CSD goes from 100db to 50db and the wavelet goes down to 20db if I recall correctly. Yes, the light blue in the dark blue background are some artifacts, some of which seem to have some repeating pattern over time.
I have talked with the developer, he is aware of the changes and looking for a better solution. It seems that for this particular case, MLS signals generate a DC offset which results in some artifacts.
Well, yes, an MLS signal does have a bit of DC. Windowing a signal with a DC offset as it is done when the CSD is calculated will cause some artifacts showing up at frequencies above DC. This effect is not unexpected and it is related to the CSD+MLS method per se. I would not consider this as a problem with the software.
Second set of questions:
1. Can we generate a tolerance envelope for frequency response and distortion (and other measurements perhaps) from a golden model.
2. If yes for 1, is it possible to collect measurements from a collection of DUTs to see if they fall in the tolerance envelope, and flag units that do not?
3. If yes for 2, does this data collection need to be collected in a single test session, or can data be added as additional DUTs of the same are tested.
4. Can we compare measurements and generate difference plots?
1. Yes, you can. In MI, up to five reference curves can be assigned to each channel in the oscilloscope and/or spectrum analyzer. They can be created through either copying a measured curve or using a CSV TXT file. Optionally, each reference curve can be defined as a High-High, High, Low, Low-Low, or similarity reference. The HH, H, L and LL limits have their own DDPs (Derived Data Points), which are used to indicate whether these limits (envelope) are exceeded or not. This is in additional to the visual “envelope” display on the screen. Similarity functions in time domain and frequency domain are reserved functions for further development. The reference curve function can be accessed via right clicking the oscilloscope / spectrum analyzer window and select [Reference] in the popup menu.
2. The aforementioned HH, H, L, LL DDPs can be used to activate a visual or sound alarm via DDP viewer, or assessed by the Device Test Plan as a part of the Pass/Fail Check.
The “Envelope” method is more for frequency response type of tests. Nonlinear distortion test such as THD test will generate its own set of DDPs. For example, up to 100 harmonics’ amplitudes and phases can be accessed individually through their respective DDPs, in addition to the THD DDP itself. These DDPs can be assessed to form a Pass/Fail criterion.
3. The Device Test Plan can be firstly configured as a complete test for a single DUT. Multiple DUT tests can be performed by simply looping the single DUT test. Barcode reader or manual entry of DUT identification code is supported in Device Test Plan in order to differentiate DUTs. CSV TXT file based daily and monthly reports can be generated.
4. Sorry, I am not so clear about the question asked. If you meant to generate the difference plot between two arbitrary curves, the answer is NO. But you can export the curve data to EXCEL and then generate the difference plot. If you meant Bode Plot (which shows the difference between the input and output) , then the answer is yes.
Thanks for the response! I am considering using this software for more electronics related measurements which generally have lower noise and more linear. One of the goals is to look into meaning full difference in measurements among cables (analog and digital) which correlates with the difference we hear in practice. CSD and Wavelet are the main tools I am considering to use. I am also wondering what can be recommended with the understanding of Mi Pro.
Fixed no.
1- anatech
2- kevinkr
3- lemon
4- PH104
5- douggoldberg
6- bk856er
7- mlloyd1
8- tjencks
9- agdr
10- waltzingbear
11- Dennis Hui
12- jwilhelm
13- 1audio (Demian)
14- soongsc
15- jhenderson01075
16- jazid
17- lbud4
18- diyaudnut
19- SilentGrace
20- acg
21- Ghianni
22- etlasr
23- B&W_arthur
1- anatech
2- kevinkr
3- lemon
4- PH104
5- douggoldberg
6- bk856er
7- mlloyd1
8- tjencks
9- agdr
10- waltzingbear
11- Dennis Hui
12- jwilhelm
13- 1audio (Demian)
14- soongsc
15- jhenderson01075
16- jazid
17- lbud4
18- diyaudnut
19- SilentGrace
20- acg
21- Ghianni
22- etlasr
23- B&W_arthur
+1goals is to look into meaning full difference in measurements among cables (analog and digital) which correlates with the difference we hear in practice.---snip---I am also wondering what can be recommended with the understanding of Mi Pro.
One of the goals is to look into meaning full difference in measurements among cables (analog and digital) which correlates with the difference we hear in practice. CSD and Wavelet are the main tools I am considering to use. I am also wondering what can be recommended with the understanding of Mi Pro.
To investigate the cause of auditory difference (if any) between analog and digital connections, IMO, one has to compare the differences in all aspects including linear and nonlinear distortions as well as noises. Nonlinear distortion measurements should not only contain traditional THD and IMD measurements, but also include psychoacoustically based metrics such as GedLee metric, which is currently only available in MI.
BTW, the cause of the difference may not only be attributed to the cable difference, but also the difference in signal paths where different electronics are involved.
Last edited:
1- anatech
2- kevinkr
3- lemon
4- PH104
5- douggoldberg
6- bk856er
7- mlloyd1
8- tjencks
9- agdr
10- waltzingbear
11- Dennis Hui
12- jwilhelm
13- 1audio (Demian)
14- soongsc
15- jhenderson01075
16- jazid
17- lbud4
18- diyaudnut
19- SilentGrace
20- acg
21- Ghianni
22- etlasr
23- B&W_arthur
24- markus22ch
2- kevinkr
3- lemon
4- PH104
5- douggoldberg
6- bk856er
7- mlloyd1
8- tjencks
9- agdr
10- waltzingbear
11- Dennis Hui
12- jwilhelm
13- 1audio (Demian)
14- soongsc
15- jhenderson01075
16- jazid
17- lbud4
18- diyaudnut
19- SilentGrace
20- acg
21- Ghianni
22- etlasr
23- B&W_arthur
24- markus22ch
To investigate the cause of auditory difference (if any) between analog and digital connections, IMO, one has to compare the differences in all aspects including linear and nonlinear distortions as well as noises. Nonlinear distortion measurements should not only contain traditional THD and IMD measurements, but also include psychoacoustically based metrics such as GedLee metric, which is currently only available in MI.
BTW, the cause of the difference may not only be attributed to the cable difference, but also the difference in signal paths where different electronics are involved.
I have a friend whom decided to get a graduate degree in electro acoustics after being in the audio industry most of his life. They did do such distortion measurements, although such measurements did show some barely visible difference on an AP setup, the amplitude could in no way be compared to the magnitude of difference heard.
I am not familiar with the GedLee metric, but for example, how would it explain relationship with “better performer/instrument separation”, better “sound stage width”, better “image depth”, “darker background”, etc.
Although I have found cable impedance to be a driving factor, but there were some cases where the impedance measured the same but sounded very different. Up to now, I have not seen any meaningful measured difference in digital connections.
Currently most measurements look at the forced response aspects of systems, my idea is to look at the natural response aspects of systems. Thus looking at CSD and Wavelet as an intermediate solution to the issue to look for meaningful differences. So I am hoping some other data processing methods and test methods will pop up.
So have I missed anything?
Dear soongsc,
With respect to your GedLee Metric (Gm distortion) question it is a means of measuring nonlinear distortions of an audio device under test (DUT). To learn more about it I would suggest you start by reading Dr. Earl Gedde’s great papers on this topic which can be freely downloaded here: GedLee LLC
While I applaud the types of questions you’re asking, the answers to such questions are exceptionally complex, e.g., how does one ensure correlation between a given set of semantic terms (e.g., “sound stage width; image depth; darker background,” etc.) to how a given group of listeners audibly perceives such concepts? First we have to collectively define the terms; train listeners; conduct double-blind studies; take the derived data from such studies and then apply statistical analysis to the data, etc.
The aforementioned is no easy task and doing good psychoacoustic research is a time consuming and arduous task to be sure. I am the person who proposed some of the new objective measurements to Virtins Technology based on my formal educational background, my experience, and my reading of various audio peer reviewed journal articles from the AES, ASA, etc. and Virtins agreed with the rational of my proposals and now we have things like the GedLee Metric build into MI Pro.
The above all happened over a period of several months, but it was only in the fast few months that these newer objective measurement capabilities have been added to MI Pro. For example, with Gm distortion there hasn’t been any commercial audio analyzer in the world built to measure it. It will take time for such psychoacoustic studies to be done. The point was to ensure the tool was available to the public to allow for such research to start, enter MI Pro and its newer distortion measuring feature set.
Some of the semantic terminology you’ve used in your questions are really more in line with spatial audio metric measurements such as:
- Interaural cross correlation (IACC), see: https://bit.ly/2ytTGew (larger rooms)
- Interaural Cross-Correlation Fluctuation Function (IACCFF) for smaller rooms is a far less well known variant, see: AES E-Library >> Interaural time difference fluctuations: their measurement, subjective perceptual effect, and application in sound reproduction
- Diffuse-Field Transfer (DFT) function another small room spatial audio objective measurement, see: AES E-Library >> Objective Measures of Spaciousness and Envelopment
There are other spatial audio measurements besides the above as well e.g., Apparent Source Width (ASW), etc. There are several ideas for additional measurements I have in mind to propose to Vitrins Technology for them to consider implementing into MI Pro, e.g., IACCFF and DFT (above). I have the MATLAB code given to me by the authors of the AES papers but I haven’t even had a chance to propose these measurements to Virtins (yet). There are simply more pressing matters right now for Virtins to attend to, e.g., coding the custom API for MI Pro to work hand-in-glove with the RTX6001 to allow for autoranging and autoscaling functionality, etc.
Some great starter AES papers I would recommend on this postings topic are as follows:
- Spatial Quality Evaluation for Reproduced Sound: Terminology, Meaning, and a Scene-Based Paradigm by Dr. Francis Rumsey, see: AES E-Library >> Spatial Quality Evaluation for Reproduced Sound: Terminology, Meaning, and a Scene-Based Paradigm
- Subjective Assessment of the Spatial Attributes of Reproduced Sound by Dr. Francis Rumsey, see: https://bit.ly/2KbiP2o
- A Method for Training Listeners and Selecting Program Material for Listening Tests by Dr. Sean Olive, see: https://bit.ly/2lseD0h
I do wish that Virtins Technology and I had the time, budget and resources to conduct the types of psychoacoustic listening test using groups of trained listeners to give definitive answers to the types of questions you’re asking. They are good questions, but alas, we are simply looking at the various audio peer reviewed journal articles and using our collective experience and formal respective graduate school educational backgrounds and deciding on which ideas to bring into MI Pro to enhance its already impressive array of measurement features.
Thank you for your questions and have a great day!
V/R,
MI Pro
Last edited:
I am only evaluating what I can use Mi Pro for in additional to what I have now.
Frankly, I have read lots of papers, but not the GedLee metrics, most do not address reality. This is common across various disciplines of academic research where conditions are assumed in such a matter to bring out meaningful results suitable for publishing while losing sight of reality, and they wonder why people do not apply their work.
I am sure that perhaps people more familiar with the GedLee metrics could jump in and explain how they would use it?
I am only evaluating what I can use Mi Pro for in additional to what I have now.
Frankly, I have read lots of papers, but not the GedLee metrics, most do not address reality. This is common across various disciplines of academic research where conditions are assumed in such a matter to bring out meaningful results suitable for publishing while losing sight of reality, and they wonder why people do not apply their work.
I am sure that perhaps people more familiar with the GedLee metrics could jump in and explain how they would use it?
Dear soongsc,
A good example / discussion surrounding the GedLee Metric and a good use for it can be summed up in my posting # 2307 at: DIY Audio Analyzer with AK5397/AK5394A and AK4490 - Page 231 - diyAudio
I would agree with your contention that some, but by no means all, of the various academic research studies often times have no real world application. That’s why one has to be very careful with respect to which ones to choose to implement into a given analyzer (and there are many). I happen to agree with my friend Keith Howard’s written comments with how he sees the GedLee Metric (http://www.gedlee.com/Papers/THD_.pdf) where at the end he sums up his option on this matter as follows:
“…here's a rallying cry to all in the audio industry who find the status quo regards nonlinear distortion measurement a lingering stain on our collective escutcheon. Adopt the GedLee metric, use it, refine it, and we may yet consign today's unsatisfactory methods to the dustbin of history, where they have long since belonged…”
Of course no one is forcing people who own / use MI Pro to make Gm distortion or NCD and other unique objective measurements. It is up to each end user to decide if they desire to make such measurements vs. the traditional THD and IMD type of measurements (the latter types which MI can of course also do). It is simply giving the end users of MI Pro more options to choose from.
Please remember too, that as MI Pro adds yet additional unique measurement capabilities, all such upgrades are 100% free of charge, e.g., if you own MI Pro all newly developed features, new Windows O/S that come out and fixes to ensure MI Pro works with them, etc. are 100% free for life too. Whether a given end user decides to make use of some of these measurement capabilities is of course their own choice to make.
V/R,
MI Pro
Last edited:
- Status
- This old topic is closed. If you want to reopen this topic, contact a moderator using the "Report Post" button.
- Home
- Group Buys
- GB for Virtins MI Pro for RTX6001 autoranging/autoscaling & for soundcard end users