1.That is very strange.
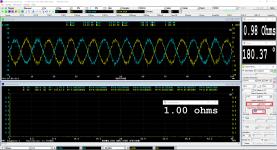
I conducted a RTX6001 loopback test (differential output to differential input) based on one of the PSF files. The input ranges of both channels are set to 141.4mV. A 10uV-peak sinewave was generated in each channel. The generated phase difference of the two sinewaves was 180 degrees. The measured phase difference was 180.37 degrees and the measured impedance is 0.98 ohms which are very good despite the background noises. (see attached screenshot). So it looks like there is no problem in my setup including both software and hardware. Could that strange behavior have something to do with the possible ground loop issue in your setup (due to SE output is used?) ?
2. Improvement on Impedance Formula
I realized that the impedance UDDP definition can actually be improved. Currently it is defined as:
1*[RMS_A(EU)]/[RMS_B(EU)]
where [RMS_A(EU)] and [RMS_B(EU)] are the total RMS values of Ch.A and Ch.B respectively. It would be better to use the following formula instead:
1*[f1RMS_A(EU)]/[f1RMS_B(EU)]
where [f1RMS_A(EU)] and [f1RMS_B(EU)] are the RMS values of the peak frequency detected in Ch.A and Ch.B respectively. The latter one is immune to noises. In the above example, the measured impedance is 1 ohms using the improved formula (see attached screenshot), which is more accurate.
3. Overlay multiple curves in the X-Y Plot of Device Test Plan
After a measurement is done, right click impedance vs frequency graph and select [X-Y Plot Reference], and then click the COPY button to copy the currently displayed curve to a reference curve. After that, you can perform the next measurement. Up to five reference curves can be overlaid in each X-Y Plot of the Device Test Plan.
Attachments
An impedance measurement should include the phase relationship. If the amplitude is the same and the load is an RC network you could get misleading results. For example a 1 uF cap in series with a 160 Ohm resistor would have the same voltage across each at 1 KHz but the voltages will not add up to the terminal voltage. I attached a minimal LTspice schematic to demonstrate this.
Measuring the output Z of a power supply you will have a reactive component from the filter cap. Usually you won't see the self resonance below 100 KHz but it can happen sometimes. The output impedance of the active circuitry is inductive by nature (the gain decreases with frequency so the output impedance rises and looks inductive). Typically you will see some resonant minimum and then it will start to increase.
I'm not sure how the formula would incorporate that info. The better impedance bridges will show an equivalent circuit to the impedance at the test frequency. There are a number of methods for displaying this info but most here would be lost with a Smith cart for example.
I have an HP low Z meter that can ignore the reactive component and measure only the resistive part which is very useful when measuring low values down to 1 milliOhm.
Attachments
1.That is very strange.
I conducted a RTX6001 loopback test (differential output to differential input) based on one of the PSF files. The input ranges of both channels are set to 141.4mV. A 10uV-peak sinewave was generated in each channel. The generated phase difference of the two sinewaves was 180 degrees. The measured phase difference was 180.37 degrees and the measured impedance is 0.98 ohms which are very good despite the background noises. (see attached screenshot). So it looks like there is no problem in my setup including both software and hardware. Could that strange behavior have something to do with the possible ground loop issue in your setup (due to SE output is used?) ?
- Yes, it is very strange! I repeat exactly what you have done but with SE output, and it seems clearly, that the Ch.A (blue light) has a noise issue (ground loop?)
Please, give me the diagram of differential output that you used. You used only one xlr output with hot and cold or you used the two xlr outputs and take the hot ones?
...
3. Overlay multiple curves in the X-Y Plot of Device Test Plan
After a measurement is done, right click impedance vs frequency graph and select [X-Y Plot Reference], and then click the COPY button to copy the currently displayed curve to a reference curve. After that, you can perform the next measurement. Up to five reference curves can be overlaid in each X-Y Plot of the Device Test Plan.
- It is done! You are the best!
I thought you were using the diagram in your post #427, where the Hot XLR and Cold XLR of the RTX output replaces the transformer secondary. The only thing missing is that RTX ADC Cold Ch. A & B should be connected to the GND of the power supply to be measured, which was not shown in that diagram.
For loopback test, pin-to-pin matching is used.
For loopback test, pin-to-pin matching is used.
Improving measurement SNR by narrowing the frequency band of interest
An impedance can be represented by its magnitude and phase in polar form, from which its resistive and reactive components can be readily derived. In this particular case, the magnitude of the power supply output impedance is equal to the division of the two RMS voltages (not the instantaneous voltages).
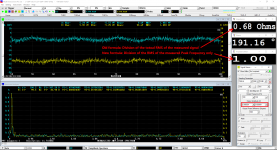
According to the previous measurements, the two RMS voltages are above 1mV which are not very small compared to the minimum voltage that RTX6001 can measure. However, it is of interest to check what would be the minimum voltage that RTX6001 can measure. I have thus performed a dual 1uV 100Hz sinewave loopback test (see attached screenshot). The generated amplitude is 1uV and phase difference is 180 degree. The measured phase difference is 191 degree. The measured voltage ratio is 0.68 using the total RMS and 1.00 using the RMS at the peak frequency detected (100Hz). So the latter is still supper accurate while the former becomes inaccurate under this supper noisy condition. This example clearly shows that the measurement SNR can be improved drastically by narrowing the frequency band of interest. This can be very useful in some cases.
An impedance can be represented by its magnitude and phase in polar form, from which its resistive and reactive components can be readily derived. In this particular case, the magnitude of the power supply output impedance is equal to the division of the two RMS voltages (not the instantaneous voltages).
According to the previous measurements, the two RMS voltages are above 1mV which are not very small compared to the minimum voltage that RTX6001 can measure. However, it is of interest to check what would be the minimum voltage that RTX6001 can measure. I have thus performed a dual 1uV 100Hz sinewave loopback test (see attached screenshot). The generated amplitude is 1uV and phase difference is 180 degree. The measured phase difference is 191 degree. The measured voltage ratio is 0.68 using the total RMS and 1.00 using the RMS at the peak frequency detected (100Hz). So the latter is still supper accurate while the former becomes inaccurate under this supper noisy condition. This example clearly shows that the measurement SNR can be improved drastically by narrowing the frequency band of interest. This can be very useful in some cases.
Attachments
I thought you were using the diagram in your post #427, where the Hot XLR and Cold XLR of the RTX output replaces the transformer secondary. The only thing missing is that RTX ADC Cold Ch. A & B should be connected to the GND of the power supply to be measured, which was not shown in that diagram.
- Yes, at the start, but I had worse results vs the simple SE output.
Then I had continue with SE output.
For loopback test, pin-to-pin matching is used.
I don't understand this.
At the differential output of RTX you use the hot and cold of one xlr?
I don't understand this.
At the differential output of RTX you use the hot and cold of one xlr?
In my loopback test, the connection is as follows:
Output XLR + -> Input XLR +
Output XLR - -> Input XLR -
Output XLR GND -> Input XLR GND
There seems to be quite a few possible connections for this power supply output impedance test.
Is the GND of your power supply under test connected to the mains PE?
Is the GND of RTX-6001 connected to the mains PE? (the answer is YES if a three-prong plug is used)
In your case, you can only get good measurement result using the RTX6001 input range of 14.14V (but not with any input voltage range below that, which is strange), despite the fact that the voltage to be measured is only a few mV with RTX 6001 SE output as stimulus. Did you connect the GND of RTX6001 XLR input to the GND of the power supply under test, or the RTX6001 SE output GND, or nothing?
In your case, you did not get good measurement result using RTX 6001 differential connection for both input and output. Did you connect the GND of RTX6001 to the GND of the power supply under test in this case?
Last edited:
...
For loopback test, pin-to-pin matching is used.
Oh my God! You had write "for loopback test" and I hadn't see as stupid!!

OK my friend, it is clearly now.
"An icon is equal with thousand words" is the common phrase to many language (I think).
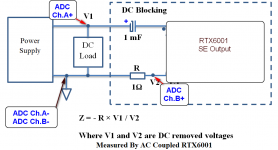
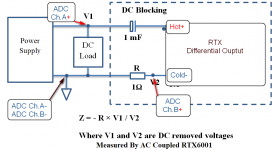
Here is the diagram, that I used for the Zo-Phase measurement
Attachments
...
Is the GND of your power supply under test connected to the mains PE?
- No
...
Is the GND of RTX-6001 connected to the mains PE? (the answer is YES if a three-prong plug is used)
- Yes
...
Did you connect the GND of RTX6001 to the GND of the power supply under test in this case?
- No
That will only work if there is no connection between the RTX chassis and the DUT. Measure the resistance between the chassis before connecting the low side.
If there is a connection you will be shorting the - out with the 1 Ohm resistor.
The Earth of the IEC plug connects to the PSU chassis, only.
The gnd of PSU isn't connected with the Earth of IEC.
RTX gnd and Earth of PSU is connected but RTX gnd and PSU gnd isn't connected.
1) I removed the " GND of RTX-6001 from the mains PE" (removed the IEC-Earth from RTX) and test it again.
Nothing the same behavior as before.
2) I removed and Earth-IEC from PSU, nothing the same and here.
3) I removed the (1) and (2), again the same behavior.
The issue is still.
Nothing the same behavior as before.
2) I removed and Earth-IEC from PSU, nothing the same and here.
3) I removed the (1) and (2), again the same behavior.
The issue is still.
Some thing special about RTX6001's input DC coupling
@lemon
Thank you for the detailed information provided. I do not seem to find any problem on your connection described. It looks like that the issue should be caused by something else....
It had been known that RTX6001 could measure an AC signal only even under DC coupling mode. Therefore, the three Panel Setting Files (PSF) in this power supply output impedance test were configured as DC-coupled, in order to test the impedance at very low perturbation frequencies. However, the DC coupling is still DC coupling not AC coupling. It cannot measure a DC signal due to its internal digital high pass filter after ADC (my guess only). Under DC coupling, the DC component of the power supply under test will go directly to RTX6001's pre-amp which will cause it saturated if the input attenuation is not set properly. Therefore, the issue should be solved by using AC coupling instead in the three PSF files.
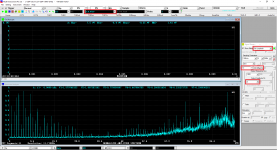
RTX6001 can output DC signals. I have thus performed the following tests to verify the above analysis. A 10VDC + 2VAC (amplitude) signal is generated from the RTX6001 signal generator (see attached)
Figure 1 shows the software loopback test. Both DC and AC components are captured in the oscilloscope.
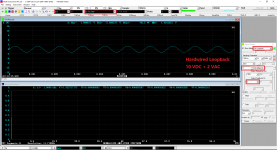
Figure 2 shows the hardwired loopback test, input DC coupled, Input Range +/-14.14V. Only AC component is captured in the oscilloscope due to the high pass filtering after ADC.
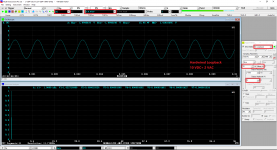
Figure 3 shows the hardwired loopback test, input DC coupled, Input Range +/-4.472V. No signal is captured in the oscilloscope due to input DC saturation and digital high pass filtering after ADC.
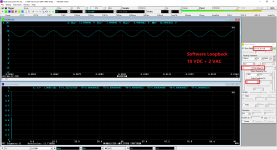
Figure 4 shows the hardwired loopback test, input AC coupled, Input Range +/-4.472V, only AC component is captured (DC component is removed by AC coupling).
@lemon
Thank you for the detailed information provided. I do not seem to find any problem on your connection described. It looks like that the issue should be caused by something else....
It had been known that RTX6001 could measure an AC signal only even under DC coupling mode. Therefore, the three Panel Setting Files (PSF) in this power supply output impedance test were configured as DC-coupled, in order to test the impedance at very low perturbation frequencies. However, the DC coupling is still DC coupling not AC coupling. It cannot measure a DC signal due to its internal digital high pass filter after ADC (my guess only). Under DC coupling, the DC component of the power supply under test will go directly to RTX6001's pre-amp which will cause it saturated if the input attenuation is not set properly. Therefore, the issue should be solved by using AC coupling instead in the three PSF files.
RTX6001 can output DC signals. I have thus performed the following tests to verify the above analysis. A 10VDC + 2VAC (amplitude) signal is generated from the RTX6001 signal generator (see attached)
Figure 1 shows the software loopback test. Both DC and AC components are captured in the oscilloscope.
Figure 2 shows the hardwired loopback test, input DC coupled, Input Range +/-14.14V. Only AC component is captured in the oscilloscope due to the high pass filtering after ADC.
Figure 3 shows the hardwired loopback test, input DC coupled, Input Range +/-4.472V. No signal is captured in the oscilloscope due to input DC saturation and digital high pass filtering after ADC.
Figure 4 shows the hardwired loopback test, input AC coupled, Input Range +/-4.472V, only AC component is captured (DC component is removed by AC coupling).
Attachments
-
 RTX6001Output10VDC+2VACHardwiredLoopbackInputRange4.472VDCcoupled.png102.4 KB · Views: 284
 -
 RTX6001Output10VDC+2VACHardwiredLoopbackInputRange14.14VDCcoupled.png83.4 KB · Views: 276
 -
 RTX6001Output10VDC+2VACSoftwareLoopback.png81.8 KB · Views: 279
 -
 RTX6001Output10VDC+2VACHardwiredLoopbackInputRange4.472VACcoupled.png82.3 KB · Views: 276
Thanks Virtins, for the supporting.
From what I have seen at your post, the issue that I have should be solved by AC coupling in the three PSF files.
I have done the tests and yes the issue has gone.
In the meantime, I tried and the new Improvement on Impedance Formula that you have presented at the #441 post.
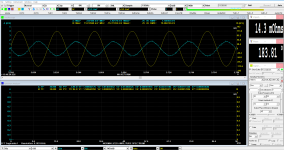
I opened a psf file, set the coupling to AC with ±141.4mV level and Output Frequency to 30Hz.
The Zo Impedance Formula was the old.
The result was a Zo=14.3mOhms and a Phase of 183.81° (see the first attachment).
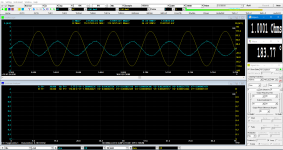
I kept the same settings but now I changed the Impedance Formula to the new one.
The result was a Zo = 1 Ohm and a Phase of 183.77°(see the second attachment)
The Phase has remain the same but the Impedance has a major difference, it is not a small change due to a more precisely formula!
For this reason, at the same time I connected a Fluke45 multimeter to the two measurement spots (V1/V2).
At the V1 measure the Vac output (1.22mV), at the V2 measure the current (63.51mA) through 1 Ohm resistor by the drop voltage (Vac) at the edge of resistor.
With that we have a Ζο=17.8mOhms.
At this example, It seems that the old formula gives more precisely results that the new one (14.3mOhms vs 17.8mOhms vs 1 Ohm).
From what I have seen at your post, the issue that I have should be solved by AC coupling in the three PSF files.
I have done the tests and yes the issue has gone.
In the meantime, I tried and the new Improvement on Impedance Formula that you have presented at the #441 post.
I opened a psf file, set the coupling to AC with ±141.4mV level and Output Frequency to 30Hz.
The Zo Impedance Formula was the old.
The result was a Zo=14.3mOhms and a Phase of 183.81° (see the first attachment).
I kept the same settings but now I changed the Impedance Formula to the new one.
The result was a Zo = 1 Ohm and a Phase of 183.77°(see the second attachment)
The Phase has remain the same but the Impedance has a major difference, it is not a small change due to a more precisely formula!
For this reason, at the same time I connected a Fluke45 multimeter to the two measurement spots (V1/V2).
At the V1 measure the Vac output (1.22mV), at the V2 measure the current (63.51mA) through 1 Ohm resistor by the drop voltage (Vac) at the edge of resistor.
With that we have a Ζο=17.8mOhms.
At this example, It seems that the old formula gives more precisely results that the new one (14.3mOhms vs 17.8mOhms vs 1 Ohm).
Attachments
DDPs (Derived Data Points) and their sources
Sorry, in Post# 441, I forgot to mention the information below.
In MI, a DDP (Derived Data Point) is generated by its source, e.g. oscilloscope, spectrum analyzer, or multimeter, etc. There are more than 200 DDPs in MI. A complete list of DDPs and their descriptions can be found in Section 6.2.1 of the software manual. When a DDP has "(EU)" (Engineering Unit) in its name, its unit will change with the [Setting]>[Calibration]>"Sensory Sensitivity and Unit" and Y scale as well as other settings of its source.
RMS_A(EU) and RMS_B(EU) are total RMS values calculated by the oscilloscope. f1RMS_A(EU) and f1RMS_B(EU) are the RMS values of the highest peak frequency calculated by the spectrum analyzer (therefore nearly all noises are excluded).
In the three PSF files, [Spectrum Analyzer Y Scale] is set to “Relative Mode”>”Linear”. Under this mode, the RMS value of each frequency bin is normalized by the RMS value of the peak frequency bin in each channel. This normalization process makes f1RMS_A(EU) and f1RMS_B(EU) unitless and not comparable across channels. To make the output impedance measurement formula in Post #441 work properly, right click the spectrum analyzer and select [Spectrum Analyzer Y Scale]>“Absolute Mode”>”Vrms”. Do the same things for the three PSF files and save them. Then it will work.
Last edited:
Thanks, I have correct it already and it is fine now.
Mine Ζο measurements are the 2.4-30 mOhm and I am wondering which cable parameters are important for more precisely measurements.
ADC xlr cables (for V1/V2 spots) are important to have the minimum length?
Is the ESR of capacitor important to this measurement and if it is related, can we put a bigger capacitor than 1000uF for a lower ESR?
RTX6001 differential output impedance is about 100 ohms, the impedance of 1mF capacitor at 1Hz is 159 ohms, so the AC current is about 10 V/(159+100+1+0.0xx) ohms=0.038 A (peak) at 1Hz. The voltage drop across a 2 mohms impedance would be 76 uV (peak). To increase the SNR of the measurement, the excitation AC current needs to be increased, which is hindered by the output impedance of RTX6001 as well as the impedance of the DC blocking capacitor, especially the former as the latter drops fast with the excitation frequency.
Last edited:
ADC xlr cables (for V1/V2 spots) are important to have the minimum length?
No, given the 200k input impedance of RTX6001 and the low testing frequencies.
- Status
- This old topic is closed. If you want to reopen this topic, contact a moderator using the "Report Post" button.
- Home
- Group Buys
- GB for Virtins MI Pro for RTX6001 autoranging/autoscaling & for soundcard end users