Vikash said:A zobel will flatten the impedence rise caused as a result of VC inducance. This allows crossovers in that region to function better/more predictably.
http://www.trueaudio.com/st_zobel.htm
That's only part of the story.
http://www.silcom.com/~aludwig/Sysdes/Crossove_Design.htm#Impedance_compensation
I've resurected this thread because I want to compares to Vikash first post.
After 12months of no progress on building the filters etc for my heggs http://www.diyaudio.com/forums/showthread.php?postid=787223#post787223 I'm finally about to finish them off.
I've got the hang of Speaker Workshop now, but am still using the laptops inbuilt souncard, and the RS SPL meter as the microphone. The pulse response shows that the delay(latency) varies from 25ms to 35ms (2nd pulse 3.5ms later) which makes it impossible to do the gated response. Also the response disappears above 10kHz.
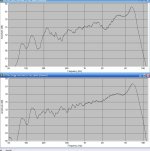
Bottom is my farfield response from 0.7m. The driver is about 1m above the carpeted floor. Above it is Inranks enclosure that I bought http://www.diyaudio.com/forums/showthread.php?postid=1077057#post1077057
My (optimistic) analysis follows, please comment.
Below 200Hz? is to be ignored due to method of measurement?
The steady rise from 350ish to 4K is about 6db of baffle step.
The baffle diffraction is quite good, +/-1.5db compared to the box.
The 7db peak at 6.5KHz is expected, eg see post #1.
Note: I still don't understand why Vikashs plot doesn't show a baffle step.
After 12months of no progress on building the filters etc for my heggs http://www.diyaudio.com/forums/showthread.php?postid=787223#post787223 I'm finally about to finish them off.
I've got the hang of Speaker Workshop now, but am still using the laptops inbuilt souncard, and the RS SPL meter as the microphone. The pulse response shows that the delay(latency) varies from 25ms to 35ms (2nd pulse 3.5ms later) which makes it impossible to do the gated response. Also the response disappears above 10kHz.
Bottom is my farfield response from 0.7m. The driver is about 1m above the carpeted floor. Above it is Inranks enclosure that I bought http://www.diyaudio.com/forums/showthread.php?postid=1077057#post1077057
My (optimistic) analysis follows, please comment.
Below 200Hz? is to be ignored due to method of measurement?
The steady rise from 350ish to 4K is about 6db of baffle step.
The baffle diffraction is quite good, +/-1.5db compared to the box.
The 7db peak at 6.5KHz is expected, eg see post #1.
Note: I still don't understand why Vikashs plot doesn't show a baffle step.
Attachments
In my enclosure, the predicted baffle step (using The Edge software) is from around 200Hz and peak to +8db at around 1k and then ripples within +/- 1.5db from 2k up.
My measurements show a +6db rise from about 300Hz up to about 1-2k and then with little ripple after that which fits nicely with software prediction. I use a notch to flatten this area out as the natural bass response in my enclosure below 300Hz doesn't require further compensation according to measurements.
FYI, use the final measurments which I took in a much less ad hoc manner to make any comparissons: http://www.vikash.info/audio/FR125S/filters.asp
It might be easier to find general patterns if you increase your range. It's difficult to get an overview with a 24db scale as everything looks exagerated")
I've superimposed your measurements (green line) and scaled it onto mine. It matches reasonably well upto about 2.5k (it's the top grey line on axis w/o filters we're looking at) until it rises steadily to the first breakup peak. I'd question your measurment system/setup first.
My measurements show a +6db rise from about 300Hz up to about 1-2k and then with little ripple after that which fits nicely with software prediction. I use a notch to flatten this area out as the natural bass response in my enclosure below 300Hz doesn't require further compensation according to measurements.
FYI, use the final measurments which I took in a much less ad hoc manner to make any comparissons: http://www.vikash.info/audio/FR125S/filters.asp
It might be easier to find general patterns if you increase your range. It's difficult to get an overview with a 24db scale as everything looks exagerated
I've superimposed your measurements (green line) and scaled it onto mine. It matches reasonably well upto about 2.5k (it's the top grey line on axis w/o filters we're looking at) until it rises steadily to the first breakup peak. I'd question your measurment system/setup first.
Attachments
- Status
- This old topic is closed. If you want to reopen this topic, contact a moderator using the "Report Post" button.