During the process of burning-in (breaking-in) a set of JX92S, I noticed by accident that varying the amplitude of the excitation signal, had a quite serious effect on the observed resonance frequency of the loudspeakers. More specific, increasing the signal amplitude, the resonance frequency decreases.
The story in a few words: The JX92Ss (published Fr: 45 Hz) when purchased 25 days ago, were impedance measured with "Speaker Workshop" (S/N 697 Fr: 58Hz, S/N 698 Fr: 55Hz). Thinking (soundwise) that the proper signal for burning-in a fullrange is pink noise, I applied computer generated pink noise ~ 100mmV pp. After 200 hours, S/N 697 was measured again, Fr: 56 Hz. After 600hours, Fr: 58 Hz. Statistical variation of this kind of measurement are quite broad, so it seemed that either pink noise burning-in does not manage to break-in the suspension, or these specific JX92S were and are to remain out of specifications. Opting for the former, I applied the good old method of breaking-in woofers (sinusoidal close to Fr) to these fullranges. That was when I made a quick manual measurement of Fr (constant current method, utilizing an oscilloscope to spot the Fr) that I noticed the effect the amplitude of the excitation signal had on the resonance frequency of the speaker.
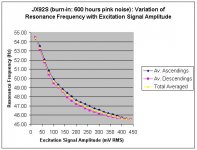
I decided to do some controlled measurements before continuing the breaking-in.: To increase the applied signal in steps of 20mV up to the point of signal clipping, record the observed Fr (ascending measurement), then reverse the process decreasing the applied signal in steps of 20mV , record the observed Fr again (descending measurement), so as to see the effects of coil temperature micro-variations, then continue repeating the same process two more times, averaging the three ascending and descending measurements. The results are shown on the attachment.
There are three points to note:
a. The existence of the effect per se. Although the observed trend is opposing the published recommendations (the smaller the signal, the lower the Fr), some afterthinking may justify the results. The stronger the signal, the greater the cone movement, the stronger the effect of the air-inertia acting upon the cone i.e. increased mass loading of the cone, thus lowering of the Fs.
b. The severity of the effect. There is a 10% lowering of the Fs for a change of 430 mV of applied electrical signal.
c. In the case that someone accepts the measurements as valid, there is one question coming up:
At which signal level should an impedance measurement be appropriately accomplished? Or in a different twisting of the words: At which signal level do manufacturers perform impedance measurements of their speakers, the results of which are published as specs?
I have to do some things to increase the undistorted level of my signal, in order to find out up to which point the observed effect holds. If the Fr continues to drop further significantly by increasing the signal level, another dangerous question is about to surface: Should we have to perform the various calculations based on the speaker's Fr which corresponds to an average "listening level " signal?
Although I have more measurements to do and submit, any comment is welcome.
Regards
George
The story in a few words: The JX92Ss (published Fr: 45 Hz) when purchased 25 days ago, were impedance measured with "Speaker Workshop" (S/N 697 Fr: 58Hz, S/N 698 Fr: 55Hz). Thinking (soundwise) that the proper signal for burning-in a fullrange is pink noise, I applied computer generated pink noise ~ 100mmV pp. After 200 hours, S/N 697 was measured again, Fr: 56 Hz. After 600hours, Fr: 58 Hz. Statistical variation of this kind of measurement are quite broad, so it seemed that either pink noise burning-in does not manage to break-in the suspension, or these specific JX92S were and are to remain out of specifications. Opting for the former, I applied the good old method of breaking-in woofers (sinusoidal close to Fr) to these fullranges. That was when I made a quick manual measurement of Fr (constant current method, utilizing an oscilloscope to spot the Fr) that I noticed the effect the amplitude of the excitation signal had on the resonance frequency of the speaker.
I decided to do some controlled measurements before continuing the breaking-in.: To increase the applied signal in steps of 20mV up to the point of signal clipping, record the observed Fr (ascending measurement), then reverse the process decreasing the applied signal in steps of 20mV , record the observed Fr again (descending measurement), so as to see the effects of coil temperature micro-variations, then continue repeating the same process two more times, averaging the three ascending and descending measurements. The results are shown on the attachment.
There are three points to note:
a. The existence of the effect per se. Although the observed trend is opposing the published recommendations (the smaller the signal, the lower the Fr), some afterthinking may justify the results. The stronger the signal, the greater the cone movement, the stronger the effect of the air-inertia acting upon the cone i.e. increased mass loading of the cone, thus lowering of the Fs.
b. The severity of the effect. There is a 10% lowering of the Fs for a change of 430 mV of applied electrical signal.
c. In the case that someone accepts the measurements as valid, there is one question coming up:
At which signal level should an impedance measurement be appropriately accomplished? Or in a different twisting of the words: At which signal level do manufacturers perform impedance measurements of their speakers, the results of which are published as specs?
I have to do some things to increase the undistorted level of my signal, in order to find out up to which point the observed effect holds. If the Fr continues to drop further significantly by increasing the signal level, another dangerous question is about to surface: Should we have to perform the various calculations based on the speaker's Fr which corresponds to an average "listening level " signal?
Although I have more measurements to do and submit, any comment is welcome.
Regards
George
Attachments
Speaker's Fr variation with signal level (2)
Implementing the constant current method, using in place of the constant current source a "normal" (low output resistance) amplifier, a series resistor of quite a high value, usually 1kohm is required. When testing a speaker, the voltage drop at this resistor is 125 to 250 (depending on Re) times the voltage drop at the speaker under test. Thus, a bench amplifier clips long before the voltage drop at the speaker under test reaches half a volt. Lowering the value of the series resistor increases this limit, but makes measurement differences more difficult to discriminate, thus measurement becomes more time consuming. An acceptable compromise is Rs: 300~400 Ohm (three 1200 Ohms 2W Carbon paralleled).
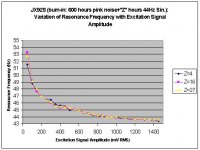
This implementation (Rs=330 Ohm) allowed me to raise the voltage drop at the speaker under test up to 1450 mV RMS. Results of three series of single measurements- 50mV step span 50mV to 1450 mV are shown in the attachment (first series is after 600 hours pink noise + 4 hours 44 Hz Sin breaking-in, second series is after 600 hours pink noise + 16 hours 44 Hz Sin breaking-in and third series is after 600 hours pink noise + 27 hours 44 Hz Sin breaking-in). These three measurements show that as signal applied to speaker increases, Fr tends to level off to a low value of around 43.5 Hz. The "specs" Fr:45 Hz is achieved with an applied signal of 600 mV RMS [this implies an amp able to supply 50V RMS if 330 Ohm series resistor is used, or 150 V RMS if 1KOhm series resistor is used].
As breaking-in with 44 Hz Sin progresses, more data will be collected and displayed for comments.
I came back at the PC I use to run the Speaker Workshop testing. The signal that feeds the speaker under test is that of the "Speaker Out" of a "SB Live![E400]" sound card (no external amp. in-between). Signal's amplitude: 83.5 mV RMS. With this signal, Speaker Workshop marked an Fr of 56-58 Hz. With the same signal level of 83.5 mV RMS, manual constant current method marks an Fr of 50.5 Hz (+/- 0.5Hz worst case ). I tend to trust the results of manual constant current method more, because the concept is well proven and all the measuring equipment involved- digital multimeter, digital frequency counter, dual analogue oscilloscope - are controlled ("calibrated").
When I have time I will try Speaker Workshop impedance measurement with an external amplifier (buffer). I may achieve better results.
Regards
George
Implementing the constant current method, using in place of the constant current source a "normal" (low output resistance) amplifier, a series resistor of quite a high value, usually 1kohm is required. When testing a speaker, the voltage drop at this resistor is 125 to 250 (depending on Re) times the voltage drop at the speaker under test. Thus, a bench amplifier clips long before the voltage drop at the speaker under test reaches half a volt. Lowering the value of the series resistor increases this limit, but makes measurement differences more difficult to discriminate, thus measurement becomes more time consuming. An acceptable compromise is Rs: 300~400 Ohm (three 1200 Ohms 2W Carbon paralleled).
This implementation (Rs=330 Ohm) allowed me to raise the voltage drop at the speaker under test up to 1450 mV RMS. Results of three series of single measurements- 50mV step span 50mV to 1450 mV are shown in the attachment (first series is after 600 hours pink noise + 4 hours 44 Hz Sin breaking-in, second series is after 600 hours pink noise + 16 hours 44 Hz Sin breaking-in and third series is after 600 hours pink noise + 27 hours 44 Hz Sin breaking-in). These three measurements show that as signal applied to speaker increases, Fr tends to level off to a low value of around 43.5 Hz. The "specs" Fr:45 Hz is achieved with an applied signal of 600 mV RMS [this implies an amp able to supply 50V RMS if 330 Ohm series resistor is used, or 150 V RMS if 1KOhm series resistor is used].
As breaking-in with 44 Hz Sin progresses, more data will be collected and displayed for comments.
I came back at the PC I use to run the Speaker Workshop testing. The signal that feeds the speaker under test is that of the "Speaker Out" of a "SB Live![E400]" sound card (no external amp. in-between). Signal's amplitude: 83.5 mV RMS. With this signal, Speaker Workshop marked an Fr of 56-58 Hz. With the same signal level of 83.5 mV RMS, manual constant current method marks an Fr of 50.5 Hz (+/- 0.5Hz worst case ). I tend to trust the results of manual constant current method more, because the concept is well proven and all the measuring equipment involved- digital multimeter, digital frequency counter, dual analogue oscilloscope - are controlled ("calibrated").
When I have time I will try Speaker Workshop impedance measurement with an external amplifier (buffer). I may achieve better results.
Regards
George
Attachments
This seems to be a great finding! ")
I also noticed that MLS signal measurements seem higher than other measurements. But I also noticed during compensation and box design that MLS measurements match SPICE modeling quite well. If I do an impedance measurement and model the impedance with SPICE, design compensation, and do SPICE simulation, measure the results and compare with the SPICE simulated results, the low end matches quite satisfactory.
Considering signal complexity, it seems that MLS signals are closer to music signals than pure sine waves.
Considering voltage source or current source, it seems that voltage source is closer to common amplfier design.
Since the ear is less sensitive to low frequencies, designing for higer voltage levels seem reasonable.
I have measured some other drivers that are closer to the spec value within spec tolarances. It would be interesting to see if the same trend occurs on drivers with different cone design and mass, ferro cooled or not.
soonqsc
Thank you for commenting.
The reason that i started this thread is the variation of Fr with signal amplitude that i noticed on JX92S by accident. This is something that i consider worth reporting. If you can supply relative data for other drivers, please do. It will help to generalize on the subject.
Besides, I was always wondering if the change in "sound character" due to breaking-in is accompanied by any measurable change in any of the speaker's parameters. I have the means to measure the Fr, so in this thread i will also report any change (if any) in Fr that i will observe with breaking-in on said speakers.
I didn't mean to attack the MLS signal measurement method (nor have i the supporting evidence). I had just to point the fact that given the said implementations of both methods of measurement, there was a discrepancy between the results of manual/auto method. If i am to question the validity of the MLS (Speaker Worksop) signal measurement method, i have to do some more homework, for which i will let you know.
There is something though, for which i am quite convinced.: "Accidental" findings tend to be observed when someone is using manual methods of testing, where man has the chance to see things happening, where man has the time to see things happening, where all parameters are set by the user, and where there is a chance for a parameter to be set so as to expose a certain "not so common" behavior of the measurement subject.
On the other hand, with automatic methods of measurements, all are happening within a few seconds, man gets the results of measurement made by the "machine" and, unless there is a good reason to question the results of the measurement (which usually mean to compare the results against some "limit values" or against some "known accepted data"), the settings of the measurement system remain as set and that's it. In industrial and R&D sectors, this comparison takes place initially at the stage of methodology validation and thereafter at regular intervals and it is named "verification" or "calibration". Automation, offers concistency in the specifications of end product by eliminating the intervention of the unreliable human factor. The questioning, the contestation of the methodology and what is to come out of it, remain the job of the unpredictable human mind.
Regards
George
I just noticed the differeneces in MLS testing because a supplier sent be drivers telling me the resonant frequency value, the test method, and test tolarance. I noticed that my method with MLS signal yielded results about 10Hz higher. Rather than debate which is correct, I just choose to acknowledge different results and different methods. Since this difference really has little effect to the majority of people.
Some drivers that I receive test within manufacture tolorances. One manufacturer mentioned that testing with small signals yield results that show higher frequencies, which seems similar to what you show.
One thing we could probably look into is to see whether ferro fluid has anything to do with this or not.
Another thing to look into is the different nature of the excitation signals.
I do not what to get into any details related with specific suppliers, but we can discuss the issue regardless of which specific drivers the results apply to.
pinkmouse said:I don't mean to offend, but what made you think that the parameters would stay the same with different input levels? T/S parameters are specifically low signal measurements.
I'm not sure if anyone is implying that T/S parameters should remain the same. It's just we noticed some variation which show a trend. It's just an exchange of ideas as to why this occurs and what does it imply, and how it would effect design decisions.
I don't mean to offend, but what made you think that the parameters would stay the same with different input levels? T/S parameters are specifically low signal measurements.
As far as I understand he is NOT questioning that a change is taking place at all but HOW the parameters change.
My feeling would also be that fs would rise with increasing drive-level. He did measure the contrary however.
So the behaviour he observed is against imagination (at least mine and his) and it would be interesting to find out why.
Regards
Charles
"low signal"
Quote:
"T/S parameters are specifically low signal measurements."
Pinkmouse, comments are welcome.
As "low signal" I would consider any signal that would cause Cone Displacement much less than ½ of Xmax, if you like up to ¼ Xmax.
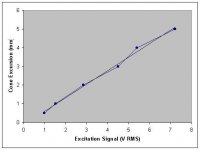
I did some rough measurements to define the relationship between Excitation Signal and JX92S Cone Displacement. Results on attached chart (Straight line represents best fit)
For JX92S, Xmax=4.5mm. My logic says that signals inducing displacement less than (4.5mm/4) = 1.1mm are considered "low signal" for this driver . From the chart this is true for signals between 0 and 1.5 V RMS
Regards
George
Quote:
"T/S parameters are specifically low signal measurements."
Pinkmouse, comments are welcome.
As "low signal" I would consider any signal that would cause Cone Displacement much less than ½ of Xmax, if you like up to ¼ Xmax.
I did some rough measurements to define the relationship between Excitation Signal and JX92S Cone Displacement. Results on attached chart (Straight line represents best fit)
For JX92S, Xmax=4.5mm. My logic says that signals inducing displacement less than (4.5mm/4) = 1.1mm are considered "low signal" for this driver . From the chart this is true for signals between 0 and 1.5 V RMS
Regards
George
Attachments
Didn't know that these drivers use ferrofluid.
According to M. Colloms also spiders, surrounds and stuffing (not in the free-air case of course) tend to cause hysteresis.
Since these are very high-quality drivers I assume that they don't show too much hysteresis and that the cause must be found elsewhere.
Regards
Charles
According to M. Colloms also spiders, surrounds and stuffing (not in the free-air case of course) tend to cause hysteresis.
Since these are very high-quality drivers I assume that they don't show too much hysteresis and that the cause must be found elsewhere.
Regards
Charles
Hi George.
The difference of 10Hz at speaker unit fs, in the range of 500mV looks serious.
If verified to happen in a variety of drivers, the excitation level sould be stated next to fs parameter at specifications.
Can you do the same measurement using a larger woofer?
My best. Anastasio.
The difference of 10Hz at speaker unit fs, in the range of 500mV looks serious.
If verified to happen in a variety of drivers, the excitation level sould be stated next to fs parameter at specifications.
Can you do the same measurement using a larger woofer?
My best. Anastasio.
phase_accurate said:Didn't know that these drivers use ferrofluid.
According to M. Colloms also spiders, surrounds and stuffing (not in the free-air case of course) tend to cause hysteresis.
Since these are very high-quality drivers I assume that they don't show too much hysteresis and that the cause must be found elsewhere.
Regards
Charles
Then maybe there is some other explanation. I accept the fact that different test methods would yield different results, but it seems that the plots George is showing uses the same method if I read his post correctly.
Speaker's Fr variation with signal level. Further measurements.
High all
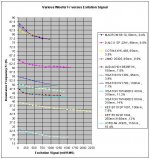
I managed to gather 10 woofers ("Fiak" kindly provided 5 of them and participated in the tests) of various diameters and brand names. I tested them for Fr variation as I do with the JX92S. Results on attachment.
As shown, the trend observed on JX92S (Fr decreasing for signal increasing) applies to all tested woofers as well, but with various slopes. Fr percentage change varies from 3.5% to 14% (16.4% for JX92S).
Only one woofer showed Fr decreasing up to a point and then increasing again.
I also tested 2 car full ranges and one TV full range.Same trend. Fr change varies little though (up to 3.5%). All three have very low Xmax (less than 1mm).
The power of the signal (VxI) at all measurements did not exceed 75mW RMS (110 mW RMS for JX92S)
Work, still in progress.
Regards
George
High all
I managed to gather 10 woofers ("Fiak" kindly provided 5 of them and participated in the tests) of various diameters and brand names. I tested them for Fr variation as I do with the JX92S. Results on attachment.
As shown, the trend observed on JX92S (Fr decreasing for signal increasing) applies to all tested woofers as well, but with various slopes. Fr percentage change varies from 3.5% to 14% (16.4% for JX92S).
Only one woofer showed Fr decreasing up to a point and then increasing again.
I also tested 2 car full ranges and one TV full range.Same trend. Fr change varies little though (up to 3.5%). All three have very low Xmax (less than 1mm).
The power of the signal (VxI) at all measurements did not exceed 75mW RMS (110 mW RMS for JX92S)
Work, still in progress.
Regards
George
Attachments
phase_accurate said:Didn't know that these drivers use ferrofluid.
According to M. Colloms also spiders, surrounds and stuffing (not in the free-air case of course) tend to cause hysteresis.
Since these are very high-quality drivers I assume that they don't show too much hysteresis and that the cause must be found elsewhere.
Regards
Charles
Given the new information, this statement seems correct. Even in free air, the VC cap and the space between that and the magnet structure would also play an important role. But I doubt there would be a trend directly related with the type of design.
Re: Speaker's Fr variation with signal level. Further measurements.
This is really quite new to a lot of DIYers. It seems that if we design acording to the flatter portion or the larger signals, it would be best for base design. If someone wants to optimize for different levels, then the middle or lower signal resonance could be used. I wonder whether there would be any audible difference though.
When the shape of an impedance curve varies based on signal level, thit would be a matter we would need to consider more.
gpapag said:High all
I managed to gather 10 woofers ("Fiak" kindly provided 5 of them and participated in the tests) of various diameters and brand names. I tested them for Fr variation as I do with the JX92S. Results on attachment.
As shown, the trend observed on JX92S (Fr decreasing for signal increasing) applies to all tested woofers as well, but with various slopes. Fr percentage change varies from 3.5% to 14% (16.4% for JX92S).
Only one woofer showed Fr decreasing up to a point and then increasing again.
I also tested 2 car full ranges and one TV full range.Same trend. Fr change varies little though (up to 3.5%). All three have very low Xmax (less than 1mm).
The power of the signal (VxI) at all measurements did not exceed 75mW RMS (110 mW RMS for JX92S)
Work, still in progress.
Regards
George
This is really quite new to a lot of DIYers. It seems that if we design acording to the flatter portion or the larger signals, it would be best for base design. If someone wants to optimize for different levels, then the middle or lower signal resonance could be used. I wonder whether there would be any audible difference though.
When the shape of an impedance curve varies based on signal level, thit would be a matter we would need to consider more.
There is nothing new under the sun!
A few days ago I purchased the excellent book "TESTING Loudspeakers" of Joseph D' Appolito (1998 Old Colony Sound Lab): From this, I quote:
Section 2.6.3.2 DRIVER PARAMETERS AS A FUNCTION OF INPUT POWER
(refers to a 8" unit with +/- 7.5 mm stated linear throw))
TABLE 2.1
DRIVER PARAMETERS AS A FUNCTION OF VOICE COIL VOLTAGE Vvc
Vvc -fsa
0.5 -30.8
1 -29.9
1.5 -28.6
2 -28.2
2.5 -28
3 -28
3.5 -27.9
4 -27.9
5 -27.9
"...Notice that fsa decreases with driver level although it does stabilize 10% lower at drive levels of 3V and above..."
So it seems that Joseph D'Appolito is certain about such a behavior (while on fourth edition-1991 Old Colony Sound Lab-of the "The loudspeaker design cookbook" by Vance Dickason" section 8.30 it is stated:"...measurement should be made at the lowest nominal voltage level at which your equipment will function. Less than 1 V would be preferable. As the driver level increases especially when measuring small diameter drivers, the resonance frequency also moves upward. The measurements being made are for use with small-signal mathematical models, so the measurement voltage should be "small".)
So, what I have observed and reported so far is not unknown or queered. This is good. I don’t have to do any more measurements.
Anyway there is (at least) one more topic open. The difference in apparent Fr values of a driver obtained with “Speaker Workshop” (SW) and manual method. I had to do SW measurements by varying the excitation signal (through an external amplifier) to see if the discrepancy would disappear with higher signal. The results were not promising:
Exc. Voltage -Fr
mV RMS -Hz
53 -54.3
85 -54
112 -53.8
169 -53.5
208 -53.8
365 -52
422 -52.8
Measuring such a signal with an RMS voltmeter is not a sound practice, but for inter-comparison it is ok. Although three measurements were c/out for each signal level and results averaged, uncertainty is still high (+/- 1 Hz). Even so, chances are that apparent (indicated) Fr remains quite stable and 7-8 Hz higher than the Fr measured manually.
I still vote for the manual method, but I would be more that happy if proof for the opposite can be found.
Regards
George
Due to the fact that normal manufacturing inspection allows for around 10% tolerance, I think it is more important to look at how much difference will cause significant effect.
The things related with this difference are:
1. Zobel network, if you use it. It is possible to just use SPICE to simulate the changes and effect.
2. Box design, it is possible to use Martin J. King's Mathcad Worksheets to simulate the effect. Note that temerature would also effect speed of sound, and thus efect the final result.
Another thing to remember is that 1W into an 8 ohm loud is 2.8 V, how taken the ear is less sensitive at low frequencies, maybe higher voltage values makes sense.
Also, don't forget the magnitude of impedance difference is also important. Do you measure that the same way?
- Status
- This old topic is closed. If you want to reopen this topic, contact a moderator using the "Report Post" button.
- Home
- Loudspeakers
- Full Range
- Speaker's Fr variation with signal level