
Impulse response:

Frequency response referenced to 100dB:

Overlays of tweeter and woofer responses:

Crossover is brickwall FIR with Blackman-Harris windowing.
Measurements made at 12". 131k sample filters are used with no filtering of raw IR of woofer and tweeter.
Performance testing of DRC filters is one goal here.
Another is testing crossover slopes impact on distortion performance.
So...more to come soon.

I have a pair of cute little 3.5L boxes I want to put these into. Can anyone suggest a port size or shall I just seal them up?
Tymphany TC9FD18-08 3-1/2" Full Range Paper Cone Woofer
Thanks in advance!
Thanks for looking;
In context of this thread your post is entirely off topic.
All this has been repeatedly explained in numerous threads across many sites.
In this regard any given driver readily has well defined behavior in closed/ported enclosures based on T/S parameters.
As you see in the posted picture, I work outside of the box.
X,
Woofer is SEAS L16RN-SL sealed in 6" diameter PVC pipe with volume of about 19 liters.
I chose raw measurement settings based on TC9FD behavior at 35Hz; level is below physical limits of driver, but audibly quite distorted. Sweep was about 6.5 volts for tweeter and with gain differences of amplifiers woofer sweep was about 5.7 volts(-1.14dB).
Measurement distance for woofer made without movement of microphone; microphone placed 12" from tweeter several degrees below tweeter axis making distance to woofer center about the same.
Both drivers have published specification of about 84dB sensitivity at 2.83vrms, 1kHz.
FR overlays of raw responses of woofer and tweeter:

TC9FD distortion plot:

L16RN distortion plot:

These are good baseline distortion figures for looking at transient distortion and transient IMD. REW has no good facility for transient distortion; for this Cool Edit will be used. With Cool Edit, band limited bursts will be used for testing. Single band burst will be used to demonstrate high correlation of generated HD to sine wave generated HD. Correlation of sine wave generated HD measurements to sweep based HD measurements is generally well accepted and easily demonstrated using REW.
Woofer is SEAS L16RN-SL sealed in 6" diameter PVC pipe with volume of about 19 liters.
I chose raw measurement settings based on TC9FD behavior at 35Hz; level is below physical limits of driver, but audibly quite distorted. Sweep was about 6.5 volts for tweeter and with gain differences of amplifiers woofer sweep was about 5.7 volts(-1.14dB).
Measurement distance for woofer made without movement of microphone; microphone placed 12" from tweeter several degrees below tweeter axis making distance to woofer center about the same.
Both drivers have published specification of about 84dB sensitivity at 2.83vrms, 1kHz.
FR overlays of raw responses of woofer and tweeter:
TC9FD distortion plot:
L16RN distortion plot:
These are good baseline distortion figures for looking at transient distortion and transient IMD. REW has no good facility for transient distortion; for this Cool Edit will be used. With Cool Edit, band limited bursts will be used for testing. Single band burst will be used to demonstrate high correlation of generated HD to sine wave generated HD. Correlation of sine wave generated HD measurements to sweep based HD measurements is generally well accepted and easily demonstrated using REW.
 OT posts split to here --> http://www.diyaudio.com/forums/full-range/276428-port-sugestions-3-5l-enclosure.html
Yes, I've found that far field measurements correlate strongly with near field corrections, at least when drivers are spaced closely relative to crossover region.
I've had no success using direct inversion correction with my radial array; and concluded that frequency dependent windowing would likely work.
With your http://www.diyaudio.com/forums/full-range/275730-convolution-based-alternative-electrical-loudspeaker-correction-networks.html#post4357092 thread frequency dependent windowing is now in grasp, and I will eventually get back to some work with radial array, but will start with this technique here after the IMD/crossover investigation.
In above tweeter harmonic distortion plots made with several watts of power it is seen that above 200Hz that THD remains below 0.5%. Figures are consistent with results seen for numerous driver units, ranging from budget to boutique prices.
From human perceptual perspective single tone stimulus provides case of minimal masking. Simple harmonic distortion content at these levels in broadband signals such as music are completely masked by human perceptual mechanism as found by other researchers such as Earl Geddes.
Klippel is perhaps leading researcher in distortion analysis for audio transducers.
A basic take home for DIY audio speaker builders is that use of drivers at or near a driver's resonance point is a sure recipe for speakers with low SPL capabilities before onset of IMD caused degradation to reproduction quality.
So here is study of TC9FD using a 1:1:1 ratio of 300Hz, 2kHz, and 3kHz. The driver has been equalized flat above 100Hz via Kirkeby inverse used with JRiver Media Center player. Digital output feeds DCX2496. Both acoustic output and drive voltage are recorded via JRiver. A sine wave signal was recorded and measured across driver leads with voltmeter for referencing voltage of recorded drive signals. DCX2496 has first order Butterworth high pass filter set at 499Hz, and is evident in results. The raw stimulus is generated with Cool Edit and imported into REW where Blackman-Harris 7term windows 37ms are applied. The resulting windowed burst is exported for use as test stimulus.
Use of such bursts has advantage over continuous mixed signal. Bursts may be used at higher power levels with little risk to driver, or observers ears. It is transient in nature, more closely emulating speaker driver conditions where audible strain first becomes apparent, and virtually all frequency response displays require use of windowed FFT of waveform anyway.
Overlay of waveform burst over raw continuous signal waveform:

Frequency response overlay of stimulus and of recorded results run at two different levels:

Levels are referenced to 0dB for 2kHz peak. Lower level of 300Hz peak responses show presence of 499Hz Butterworth high pass filter. The referencing reflects the higher noise floor associated with the lower drive level in plot #3 relative to the lower noise floor associated with the higher drive level seen in plot #4. The lower driver level has peak voltages of 11.5v and -10.4v. The higher drive level has peak voltages of 28.9v and -26.1v.
The 2kHz-300Hz intermodulation distortion peak is marked in the plot set and relative level to 0dB is shown in the plot legend.
For recording of responses the stimulus was placed into a track 10 times at 2 second intervals. Aside from intensity the sound of the playback in room is identical to my ears. Playback over headphones or speaker of response recordings with each normalized to the same level, the only obvious difference is level of background noise. Doubtless, play back of the recordings leads to introduction of another layer of IMD components, but these are constrained primarily to the original stimulus components.
It should be fairly obvious that if continuous three tone signal were used that the room sound would be loud to very loud relative to typical music listening.
Relative to music signals the three tone based burst occupies very little of the driver's frequency bandwidth. As such the driver is not staining yet in an audible manner. Other burst signals will be used to demonstrate driver performance as bandwidth is further occupied and becomes audibly strained.
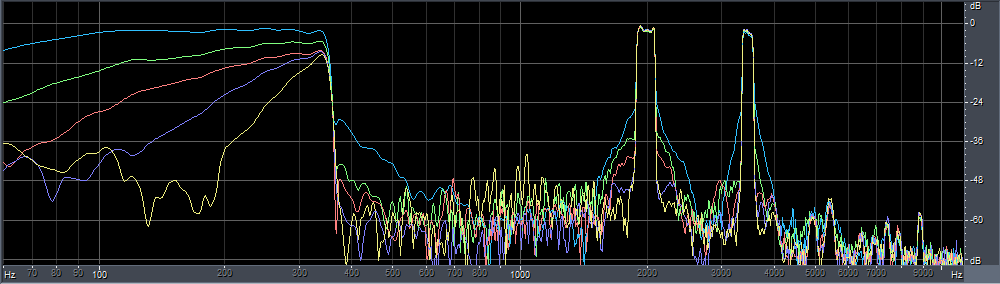
Here is frequency response overlays of a bust stimulus providing a low pass 350Hz, with a narrow band about 2kHz, and also with a narrow band about 3.5kHz. Overlays are shown with no crossover, and for high pass filters set at 350Hz for BW1, LR2, LR4, and LR8:

Clearly seen with no crossover in white traces are distortion components leaking out above 350Hz, and strong side bands that form shoulders on the 2kHz and 3.5kHz pass bands. All these decrease with increasing crossover filter order.
I will provide voltage data for this and some more analysis soon, along with some more plots.
From human perceptual perspective single tone stimulus provides case of minimal masking. Simple harmonic distortion content at these levels in broadband signals such as music are completely masked by human perceptual mechanism as found by other researchers such as Earl Geddes.
Klippel is perhaps leading researcher in distortion analysis for audio transducers.
A basic take home for DIY audio speaker builders is that use of drivers at or near a driver's resonance point is a sure recipe for speakers with low SPL capabilities before onset of IMD caused degradation to reproduction quality.
So here is study of TC9FD using a 1:1:1 ratio of 300Hz, 2kHz, and 3kHz. The driver has been equalized flat above 100Hz via Kirkeby inverse used with JRiver Media Center player. Digital output feeds DCX2496. Both acoustic output and drive voltage are recorded via JRiver. A sine wave signal was recorded and measured across driver leads with voltmeter for referencing voltage of recorded drive signals. DCX2496 has first order Butterworth high pass filter set at 499Hz, and is evident in results. The raw stimulus is generated with Cool Edit and imported into REW where Blackman-Harris 7term windows 37ms are applied. The resulting windowed burst is exported for use as test stimulus.
Use of such bursts has advantage over continuous mixed signal. Bursts may be used at higher power levels with little risk to driver, or observers ears. It is transient in nature, more closely emulating speaker driver conditions where audible strain first becomes apparent, and virtually all frequency response displays require use of windowed FFT of waveform anyway.
Overlay of waveform burst over raw continuous signal waveform:
Frequency response overlay of stimulus and of recorded results run at two different levels:
Levels are referenced to 0dB for 2kHz peak. Lower level of 300Hz peak responses show presence of 499Hz Butterworth high pass filter. The referencing reflects the higher noise floor associated with the lower drive level in plot #3 relative to the lower noise floor associated with the higher drive level seen in plot #4. The lower driver level has peak voltages of 11.5v and -10.4v. The higher drive level has peak voltages of 28.9v and -26.1v.
The 2kHz-300Hz intermodulation distortion peak is marked in the plot set and relative level to 0dB is shown in the plot legend.
For recording of responses the stimulus was placed into a track 10 times at 2 second intervals. Aside from intensity the sound of the playback in room is identical to my ears. Playback over headphones or speaker of response recordings with each normalized to the same level, the only obvious difference is level of background noise. Doubtless, play back of the recordings leads to introduction of another layer of IMD components, but these are constrained primarily to the original stimulus components.
It should be fairly obvious that if continuous three tone signal were used that the room sound would be loud to very loud relative to typical music listening.
Relative to music signals the three tone based burst occupies very little of the driver's frequency bandwidth. As such the driver is not staining yet in an audible manner. Other burst signals will be used to demonstrate driver performance as bandwidth is further occupied and becomes audibly strained.
Here is frequency response overlays of a bust stimulus providing a low pass 350Hz, with a narrow band about 2kHz, and also with a narrow band about 3.5kHz. Overlays are shown with no crossover, and for high pass filters set at 350Hz for BW1, LR2, LR4, and LR8:
Clearly seen with no crossover in white traces are distortion components leaking out above 350Hz, and strong side bands that form shoulders on the 2kHz and 3.5kHz pass bands. All these decrease with increasing crossover filter order.
I will provide voltage data for this and some more analysis soon, along with some more plots.
Klippel is perhaps leading researcher in distortion analysis for audio transducers.
A basic take home for DIY audio speaker builders is that use of drivers at or near a driver's resonance point is a sure recipe for speakers with low SPL capabilities before onset of IMD caused degradation to reproduction quality.
So I'm in big trouble then
 ... Actually I had thought about the fact noted above but remembered the impedance peak is also at the loudest gain peak of the (un EQ-ed) line array and gets EQ-ed down quite a bit, comparable to the boost at low and high frequencies. So each driver is doing next to nothing at that frequency.
Interesting test! Good to see some other form of tests done on this subject.
I should do tests like that but my room is working against me. To many things that rattle and shake. In my pre project research I had found Murphy's corner array's where he did some simple tests: The Murphy Corner-Line-Array Test Results and figured I'd be alright . I figure I have excellent performance up to my room limit, I need to start talking/trying to have a conversation before I realise how loud it actually was playing. It's very strange if you're able to up the volume but don't get the usual change in tonality, it just gets louder.
. I figure I have excellent performance up to my room limit, I need to start talking/trying to have a conversation before I realise how loud it actually was playing. It's very strange if you're able to up the volume but don't get the usual change in tonality, it just gets louder.The 50Hz results from your link show harmonic distortion indicative of significant IMD at high SPL drive. A big lunch, but not free.
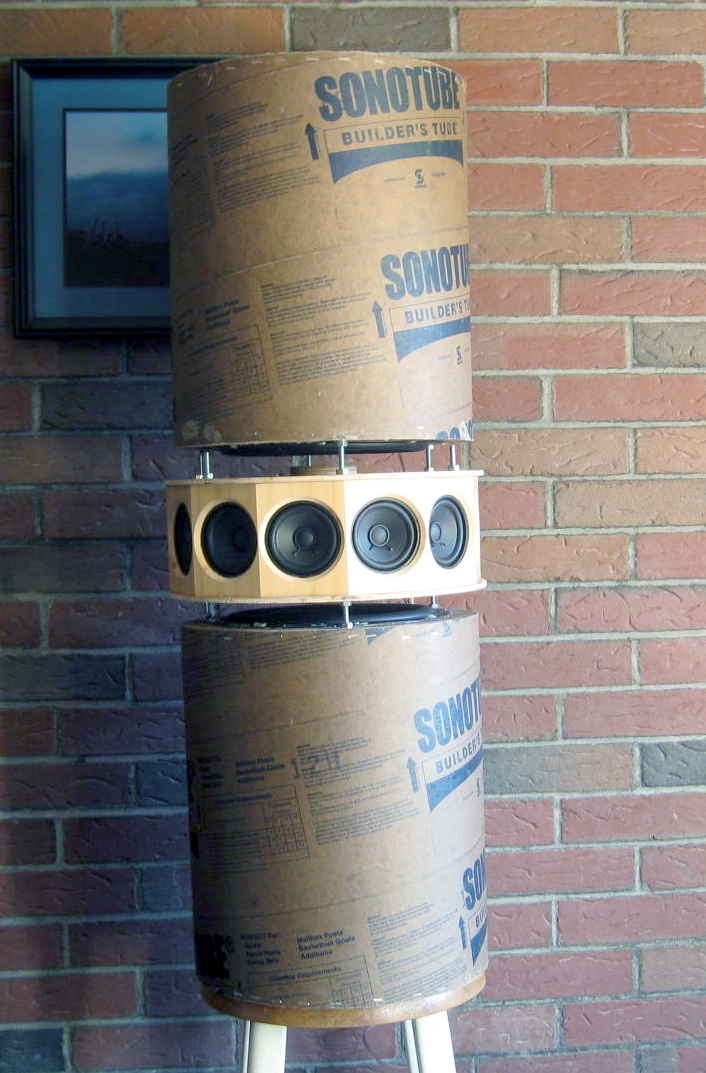
Radial array is 12 Aura NS3-194-16A 3" drivers. The small neo motors allow for the tight curvature. The Sonotubes each have Peerless 10" SLS woofers. A single Peerless 12" XLS subwoofer is used separately as mono sub; Crossover points are LR8 at 80Hz and 330Hz. Amplifiers are 2 Hafler Pro2400 and Hafler Pro1200, The 2400 is rated 120watts/8 ohm, 200watts/4 ohm. The 1200 is conservatively 60watt/8 ohm, since bridged it is rated 170watts/8 ohm. A bridged 2400 runs the sub, the second 2400 runs 2 woofers in parallel on each channel, and the 1200 runs the radial arrays which are wired to be 5.5ohm. As pictured and spaced about 7 feet apart with sub on floor in between the imaging is incredible, standing between then even just 3ft from wall the image is sharp, wide, and deep, starting just beyond the wall. With single array running so positioned and following sound source, its loudest point appears at surface of wall just behind the speaker. Cranked up the outside of the chimney associated with the brick wall pulses to the touch. The old 'Waiting for Columbus' Little Feat live compilation CD comes alive. Moved out across minor axis of room is great too. Room power response is flat.
Driver surface area is king; you've got a winner.
The band passed intermodulation distortion overlay plots in post #10 show that the TC9FD is crippled with low frequency signals when delivering transients.
The experiment is repeated, instead of a using a low pass 350Hz component, a 200Hz-350Hz band pass element is combined with the same narrow band 2kHz and 3.5kHz components:

The overlays show defined shoulders of the 200Hz-350Hz sum and difference IMD components about the narrow band 2kHz and 3.5kHz components.
Shifting the crossover point to 499Hz for use with BW1, LR2, LR4, and LR8 filter slopes, the result looks like this:

First order IMD is diminished, and higher order IMD become better defined. For the white trace results with no crossover, it is apparent that the driver struggles with frequencies 200Hz-350Hz. A casual interpretation of 400Hz-1.5kHz region is that a poor noise floor exists. When the three plot sets are looked at as a whole, it is apparent that IMD components of various orders are a significant contribution. The fewer IMD components present, the darker sounding the background is that the original signal plays in.
The 200Hz-350Hz burst component has -5.5v and 5.6v peak values. Peak values of complete stimulus are -12.4v and 13.1v. Since narrow band 2kHz and 3.5kHz components are effectively untouched by the crossover filters used, only voltage of 200Hz-350Hz band is lowered by increasing filter slope and increasing crossover frequency.
The experiment is repeated, instead of a using a low pass 350Hz component, a 200Hz-350Hz band pass element is combined with the same narrow band 2kHz and 3.5kHz components:
The overlays show defined shoulders of the 200Hz-350Hz sum and difference IMD components about the narrow band 2kHz and 3.5kHz components.
Shifting the crossover point to 499Hz for use with BW1, LR2, LR4, and LR8 filter slopes, the result looks like this:
First order IMD is diminished, and higher order IMD become better defined. For the white trace results with no crossover, it is apparent that the driver struggles with frequencies 200Hz-350Hz. A casual interpretation of 400Hz-1.5kHz region is that a poor noise floor exists. When the three plot sets are looked at as a whole, it is apparent that IMD components of various orders are a significant contribution. The fewer IMD components present, the darker sounding the background is that the original signal plays in.
The 200Hz-350Hz burst component has -5.5v and 5.6v peak values. Peak values of complete stimulus are -12.4v and 13.1v. Since narrow band 2kHz and 3.5kHz components are effectively untouched by the crossover filters used, only voltage of 200Hz-350Hz band is lowered by increasing filter slope and increasing crossover frequency.
Looking from distortion chart in post#6, it is obvious that there is a distortion "peak" to avoid below around 300Hz. So, depends on how steep the slope is, we really want to avoid the distortion and move up the crossover point way above...
Using ONLY 6dB per octave (1 octave above 300Hz is 600Hz, more or less the chosen XO frequency of the second option) it is expected that there will be distortion issues, and IMD is usually no more than just a function of distortions.
What I mean here is, it is not clear how anyone would draw a conclusion from the experiment, is the improvement due to narrower bandwith (or Doppler effect) or simply just because of the non-linear distortion involved.
IME, it is simply the issue of avoiding the non-linear distortion. I mean, if there is no such distortion "peak" below 300Hz, or if the slope is steep enough, there is no requirement to go very high with XO frequency. For me it is a matter of "threshold", about how many dB you want the response to be at below 300Hz (or where the "peak" is) and/or how this will effect phase tracking between the 2 drivers.
I might try a mild notch filter around this distortion peak. Expensive for passive, but may be not for DSP.
View attachment 490539
Impulse response:
View attachment 490540
Frequency response referenced to 100dB:
View attachment 490541
Overlays of tweeter and woofer responses:
View attachment 490542
Crossover is brickwall FIR with Blackman-Harris windowing.
Measurements made at 12". 131k sample filters are used with no filtering of raw IR of woofer and tweeter.
Performance testing of DRC filters is one goal here.
Another is testing crossover slopes impact on distortion performance.
So...more to come soon.
What DSP tools/products did you use, if you don't mind my asking?
- Status
- This old topic is closed. If you want to reopen this topic, contact a moderator using the "Report Post" button.
- Home
- Loudspeakers
- Full Range
- FAST / WAW TC9FD DSP performace testing platform