An impedance equalization network would make the speaker draw more current from the amp. Also it would not do anything against the fact that the current drawn by the speaker is not linear (as shown by my quick & dirty measurement above).
I have found my old measurement regarding this.
Attachments
Thanks, and thanks for your measurements as well. This is rather hard work, this audio design. Anyway, I definitely appreciate Mooly's enthusiasm")
I used to have more... but now
I have found my old measurement regarding this.
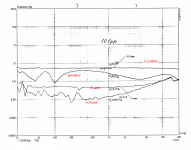
The THD curve "with speaker" looks very much like the impedance curve of a speaker, inverted. That's pretty logical after all...
The THD curve "with speaker" looks very much like the impedance curve of a speaker, inverted. That's pretty logical after all...
That's it, exactly. So it goes, as a rule of thumb, more or less pronounced.
Anyway. So, the loudspeaker current has a large amount of distortion... especially at "high" power (1W, lol).
It is reasonable to assume that this distorted current, combined with the impedance of cables and amplifier output, will create a distorted voltage at the loudspeakers terminals, and the tweeter will happily reproduce the harmonics of the woofer current.
So, that could explain why some like bi-wiring, although the theoretical effects should be non-existent...
I put a microphone in front of the speaker and ran some tests. I couldn't see a difference in the distortion profile with or without 0.5 ohm resistor in series with the speaker, so I guess this theory will stay a theory... My microphone is crap, though, unless anyone feels inclined to repeat the test with better gear...
Yes I noticed this also..... Both clips were LOW LEVEL but the first one sounded a bit betterbuzzforb said:on simple computer moniters, the first one sounds a little more forward in the midrange and seems to maintain itself s little better when the things get a little more complicated.
Thanx for the clips Mooly! (I LOVE THIS SONG AND I HAVE IT IN ANALOG
)Since you guys seem to be interested by what happens in the output stage of the amplifier, here is a test suggestion.
Amp1 drives a current (through resistor) into Amp2's output.
Amp2 tries to keep its output voltage at 0V.
Measuring the voltage at Amp2's output therefore gives its output impedance.
Hi peufeu,
I have returned to this measurement, more rigorously than before, when I measured with a scope only.
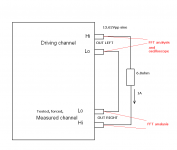
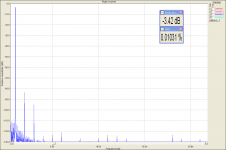
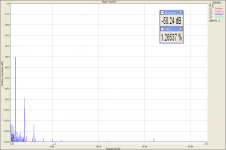
Attached you will find a test schematics. 1A current was forced from left channel of the amplifier to its right channel via 6.8 resistor. FFT of the forced channel has been performed, as well as the FFT of the driving channel output.
Distortion of the driving channel output was about 0.01%. Distortion of the forced channel output was about 1.3%. Attenuation of the 1kHz signal frequency was about -47dB (220x approx.). Distortion profile of the forced channel shows 2nd and 3rd harmonics, similarly as the distortion profile of the driving channel.
Attachments
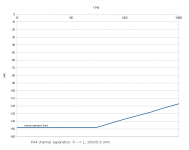
Ok, so that is not quite the same as a typical stereo amp, hence your earth common connection.It is a stereo power amplifier, but it has dual mono concept and two channels are totally separated with separated power supplies. Channel separation is excellent, as you may see in the attached measured plot.
Yes, you ought to be pretty happy with that degree of channel isolation.
Dan.
Agreed, and of course.Power supply inter-channel modulation is thus highly suppressed.
To me, it is a 'typical' stereo amp
I have tried 4 transformers (1 per each rail) and infinite earth common (sizable copper sheet) and the result was quite spectacularly good in many respects, notably centrality and stability of mono content, 'índependance' of stereo content, and portrayal of depth information, including sounds from behind the listener.
Absolute polarity also became, errr absolute.
I find there is distinct (coherence) value in combing two channels correctly into one enclosure for unbalanced input connected systems.
Dan.
Attached you will find a test schematics. 1A current was forced from left channel of the amplifier to its right channel via 6.8 resistor. FFT of the forced channel has been performed, as well as the FFT of the driving channel output.
You motivated me to do more tests !
I tried current injection but this would need at least a 8 ohm resistor, and a rather large voltage on the driving channel, to swamp its distortions. However this means I have to turn the volume knob... and then the noise on the channel under test goes up.
So, I have simply used a 0.5 ohm load resistor on one amplifier channel. The other channel is not used. The amplifier under test is driving a low voltage (up to 0.5V RMS) in this resistor, and I am simply measuring the output.
I have not used FFT, that would be too easy (and would hide too much stuff).
The test signal is the sum of :
- a low frequency (LF) sinewave around 52.73Hz
- a high frequency (HF) sinewave at 16 kHz
The test program plays the signal, records the soundcard output, then detects the HF amplitude, and plots its variations according to the LF amplitude.
I am using synchronous detection on the HF, so each HF period gives one amplitude sample. This completely removes the HF from the results data. So it is better if both frequencies are completely unrelated, as this spreads the detected samples along the LF period. Also the funny LF frequency value is due to the fact that an integer number of periods have to fit into 16384 samples, because I was lazy with the soundcard code.
It also averages lots of periods (one test takes 30 seconds) because the level of noise on this soundcard is really over the top.
Variations of amplifier output impedance translate directly into HF signal amplitude variations. The LF signal sets the amplifier output stage current.
Here is a first, simple graph.
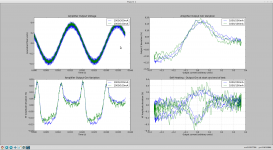
First, the legends : "1000/200mA" indicates 1000mA of LF current, plus 200mA of HF current. Remember this for the next graphs.
Top Left Plot : this is the amplifier output, over one LF period.
Bottom Left Plot : HF amplitude, synchronized with the time axis of the plot above.
Since the load is resistive, HF amplitude is proportional to output Gm (and inversely proportional to output Z).
I have displayed amplitude in % variation versus average. So, it is equivalent in % Gm variations versus average Gm.
So, we see :
- Low absolute value of current : this is inside crossover region, both output transistors work, gm-doubling occurs. HF amplitude is higher.
- High absolute value of current : only one transistor works, so gm is smaller. HF amplitude is smaller. The fact that the PNP and NPN outputs have different characteristics is clearly visible as the "valleys" in the curve are different depending on output polarity. The top transistor seems to have 2x the strength of the bottom one.
Top Right Plot : Same data, different view. Instead of time, the X-axis is low frequency current value.
Here, the Gm curve is characteristic of a little overbiased Class-AB output stage, which.
Bottom Right Plot :
Same as above, but there are two Gm plots, from the start of the test, with cold transistors, and from the end of the test, with warm transistors. At the beginning, the output stage shows under-biasing, then it warms up and becomes over-biased.
Remarks :
Global feedback is active, and there is still enough of it remaining at 16kHz to make the Gm variations very small. Still, the real behaviour of the output stage (open-loop), is clearly visible.
The green and blue curves use different values for the HF current, this does not seem to matter a lot here. See later for more on that.
Attachments
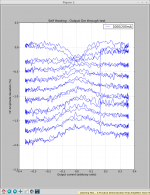
It could be interesting to investigate self-heating of the output transistors.
Here, I plotted a snapshot of Gm versus current, over time, so it is a kind of 3D view.
Each curve is an average over 0.7 seconds. I spaced them vertically for clarity.
The first curve is at the top. It shows under-biasing, classic V-shape.
The next curve, directly below, is much flatter.
Then as time passes, transistors heat, over-biasing occurs, inverted V-shape appears.
It stays stable like this until the end of the test.
So, we can see this amplifier has a thermal time constant around 2-3 seconds for the output stage. It is an integrated amp (big hybrid circuit, japanese 80's style).
During quiet music passages, its natural bias is a bit underbiased. When it gets louder, after a few seconds it will heat up and overbias. When it gets quiet again, I suspect several seconds of severe underbias could occur. I need to fix the software to find out.
BTW, this clearly shows that measuring output Gm at DC with a slow data acquisition system is completely useless... just like most tests using stationary signals, like THD, etc., which measure the performance on stationary, constant amplitude signals, not on real music signals, which vary a lot. But I guess everyone knew that
Attachments
- Status
- This old topic is closed. If you want to reopen this topic, contact a moderator using the "Report Post" button.
- Home
- General Interest
- Everything Else
- Listening Test... A Practical Demonstration That Amplifiers Have Their Own Sound.