The differences are really small. Were they both using the same mike or different microphones? The differences between the measurements could be as simple as different windowing functions. I get suspicious of too much detail in acoustic measurements, its not useful and it may be a lie. You can do very little about those tiny wiggles anyway.
Looking at REW the mike cal file is a pretty standard format but no representation of sensitivity is provided. My memory of Clio (not the latest) is that it has no provision for a mike calibration file. We have a Clio setup but no one uses it, its too klutzy for our work.
Looking at REW the mike cal file is a pretty standard format but no representation of sensitivity is provided. My memory of Clio (not the latest) is that it has no provision for a mike calibration file. We have a Clio setup but no one uses it, its too klutzy for our work.
The CLIO mic did not have a cal file. I can only do sensitivity cal with a calibrator. I did not cal for absolute level of both systems since I concerned more about the curve shape (resolution).
I will use my ECM8000 and UA-25 to compare both systems (CLIO + ECM8000 vs REW + UA-25 + ECM8000) again next. Use one mic in both systems.
I will use my ECM8000 and UA-25 to compare both systems (CLIO + ECM8000 vs REW + UA-25 + ECM8000) again next. Use one mic in both systems.
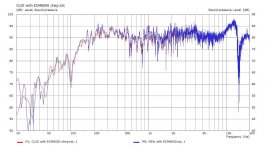
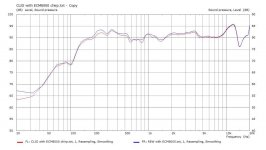
Here are data for both systems (CLIO and REW) using ECM8000 mic. One is raw data and the other is resampled and smoothed data. Resampling was used to make both data sets equal to 2048 samples.
I feel confident to use REW in all forthcoming measurements.
I feel confident to use REW in all forthcoming measurements.
Attachments
Comparisons of exported txt files is poor choice.
Apples v Oranges: CLIO chirp (log swept sine) of 16k v 256k sweep with REW
Rectangular window is also poor choice.
Use same length sweeps with same start and stop frequencies. Either export impulse response as wave file from CLIO and import into REW or other way around. Ensure that IR generated from REW and CLIO are aligned to same time reference. Use identical windowing to view frequency responses.
You will find differences are vanishingly small.
Sweep length determines temporal separation of HD components from linear IR. With short sweep and big FFT for frequency response, HD components get integrated into results.
Virtually all sound cards use capacitors on input to filter out phantom voltage used to power microphone. These and potentially capacitors at output of soundcard, and input of power amplifier determine HP characteristic of system. This usually approximates to 2nd or 3rd order Butterworth filter with f3 around 3-6Hz. Resolving long time constants of these filters typically require sweep length >2.7sec, i.e. 131072 sample sweep at fs 48kHz. Shorter sweeps result in aliasing artifacts in measured IR. All this is best explored with direct loopback excluding microphone and speakers.
Loopback IR measurements are important for verifying that soundcard isn't mixing input signal back into output test signal, and that operating system isn't mangling data with poor SRC, mixer functionality, or poor buffer management.
I've extensively tested REW's IR measurement capabilities, and it gets top marks. HOLM also gets top marks.
ECM8000 is generally good microphone, but needs individual calibration to get trusted results:
Above is plot of 40 ECM8000 microphones from a calibration service.
Apples v Oranges: CLIO chirp (log swept sine) of 16k v 256k sweep with REW
Rectangular window is also poor choice.
Use same length sweeps with same start and stop frequencies. Either export impulse response as wave file from CLIO and import into REW or other way around. Ensure that IR generated from REW and CLIO are aligned to same time reference. Use identical windowing to view frequency responses.
You will find differences are vanishingly small.
Sweep length determines temporal separation of HD components from linear IR. With short sweep and big FFT for frequency response, HD components get integrated into results.
Virtually all sound cards use capacitors on input to filter out phantom voltage used to power microphone. These and potentially capacitors at output of soundcard, and input of power amplifier determine HP characteristic of system. This usually approximates to 2nd or 3rd order Butterworth filter with f3 around 3-6Hz. Resolving long time constants of these filters typically require sweep length >2.7sec, i.e. 131072 sample sweep at fs 48kHz. Shorter sweeps result in aliasing artifacts in measured IR. All this is best explored with direct loopback excluding microphone and speakers.
Loopback IR measurements are important for verifying that soundcard isn't mixing input signal back into output test signal, and that operating system isn't mangling data with poor SRC, mixer functionality, or poor buffer management.
I've extensively tested REW's IR measurement capabilities, and it gets top marks. HOLM also gets top marks.
ECM8000 is generally good microphone, but needs individual calibration to get trusted results:
An externally hosted image should be here but it was not working when we last tested it.
Above is plot of 40 ECM8000 microphones from a calibration service.
What if you're using a USB mic? Obviously you can't run a loopback with one.Loopback IR measurements are important for verifying that soundcard isn't mixing input signal back into output test signal, and that operating system isn't mangling data with poor SRC, mixer functionality, or poor buffer management.
- Status
- This old topic is closed. If you want to reopen this topic, contact a moderator using the "Report Post" button.
- Home
- Design & Build
- Equipment & Tools
- Comparing REW, ARTA and CLIO in speaker driver and acoustic measurements