Half your luck George, I think a lot of diy'ers would love to have your form of "rent" for use of equipment when doing their diying!
I don't know.
But if they'd love to, is it so difficult for them to p*** their wifes off with their "men childish activities"?
(That's what I do. Not on purpose of course
)Edit:"men childish and useless(i.e. diyaudio) activities" buhaha
Last edited:
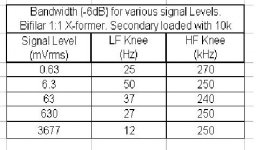
To continue with the manual bandwidth measurements of the 1:1 bifilar x-former.
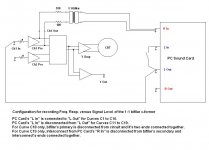
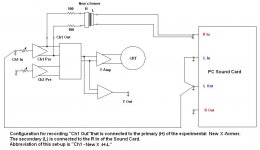
Set-up as per Measuring the input impedance, bandwidth and efficiency of transformers
With 1Vrms at the primary the –6dB LF was ~30Hz.
Oops that’s too high. Will I have to bake another one?
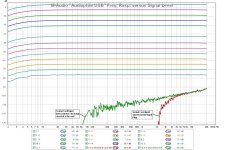
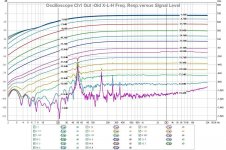
I repeated the manual measurement, this time varying the amplitude of the input signal. (att.1)
There is a faint pattern coming out. The lower the signal, the higher the LF cut-off point. This is somehow the opposite from what I was expecting to happen.
I set-up an automatic measurement (att. 2) to have a more consistent picture of this pattern.
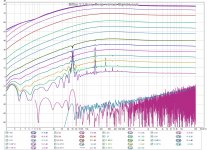
Results in att.3. (recording/analysis SW: REW V5.00)
Shown is Frequency response of the 1:1 bifilar with varying the input signal.
This is achieved by adjusting the input sensitivity of the oscilloscope and then by adjusting the output of the soundcard to get to the lowest signals.
LF roll-off is confirmed.
Numerical details are patched on, which leads to att.4
Regards
George
Set-up as per Measuring the input impedance, bandwidth and efficiency of transformers
With 1Vrms at the primary the –6dB LF was ~30Hz.
Oops that’s too high. Will I have to bake another one?
I repeated the manual measurement, this time varying the amplitude of the input signal. (att.1)
There is a faint pattern coming out. The lower the signal, the higher the LF cut-off point. This is somehow the opposite from what I was expecting to happen.
I set-up an automatic measurement (att. 2) to have a more consistent picture of this pattern.
Results in att.3. (recording/analysis SW: REW V5.00)
Shown is Frequency response of the 1:1 bifilar with varying the input signal.
This is achieved by adjusting the input sensitivity of the oscilloscope and then by adjusting the output of the soundcard to get to the lowest signals.
LF roll-off is confirmed.
Numerical details are patched on, which leads to att.4
Regards
George
Attachments
LOL so when are you starting a transformer winding business George
I might have to look at this again tomorrow, I'm a bit tired (and have had a couple of glasses of wine) so it isn't sinking in... I note that you also seem to have a problem with 50Hz interference like I do though... I got some clean measurements early on with none, but can't seem to get them any more, I don't know what changed
Tony.
LOL so when are you starting a transformer winding business George
When???
I am in full production if you did't notice!
Tony, I suggest you would better go to bed. The boss is waiting.
And mind your activities there, you had a couple of reds already.
There are a few things that worth discussing on the graph. But I am a bit tired too. I'll try in a few hours.
Regards
George
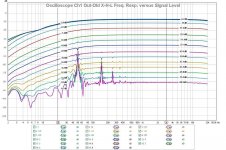
So what is this diagram with the so many curves on it?
This is basically a Signal Amplitude versus Frequency screen, upon which many frequency response curves have been dumped.
Horizontal axis is frequency (Hz)
Vertical axis is in dB. As shown in the attachment of the previous post, the range was arbitrary set by the software.
Now I edited the numbers to reflect the reality of the measuring set-up.
Therefore, on Vertical axis, 0 db is on the top and progresses downward as –db.
0dB is the highest signal that can be inputted in the sound card.
It is important to specify this 0dB signal.
How I did it? By applying continuously a sinusoidal signal around 1kHz at the card’s input. While watching the VU or Peak meters of the recording software, I adjusted the signal generator’s output, till the Vu meters showed exactly 0dB. Using an AC rms voltmeter I measured the signal entering the Sound Card.
0dB with my card equals 1.286Vrms.
After establishing the true amplitude of 0dB it is feasible to translate in Vrms any sinusoidal signal that produces a certain VU meter indication.
This way, at the right side end of each curve, it is written the signal amplitude in dBs relative to 0dB of my card, as well as the corresponding real value in mVrms.
And this is important for me because I easily forget how weak can a signal be e.g a humble -48db equals 4mV.
At the left side in the area of 20Hz, I have marked on each curve how many dbs rel to 3kHz is this curve down at 20Hz.
As you can see, with this x-former, the smaller the signal, the heavier the drop in LF, (confirmation of the manual bandwidth measurement results).
Can anyone provide a possible explanation for this?
This diagram shows me also how vulnerable can small amplitude signals be to extraneous noise and how important is to properly plan, arrange for and implement a measurement. Here, I have to quote SY
Regards
George
This is basically a Signal Amplitude versus Frequency screen, upon which many frequency response curves have been dumped.
Horizontal axis is frequency (Hz)
Vertical axis is in dB. As shown in the attachment of the previous post, the range was arbitrary set by the software.
Now I edited the numbers to reflect the reality of the measuring set-up.
Therefore, on Vertical axis, 0 db is on the top and progresses downward as –db.
0dB is the highest signal that can be inputted in the sound card.
It is important to specify this 0dB signal.
How I did it? By applying continuously a sinusoidal signal around 1kHz at the card’s input. While watching the VU or Peak meters of the recording software, I adjusted the signal generator’s output, till the Vu meters showed exactly 0dB. Using an AC rms voltmeter I measured the signal entering the Sound Card.
0dB with my card equals 1.286Vrms.
After establishing the true amplitude of 0dB it is feasible to translate in Vrms any sinusoidal signal that produces a certain VU meter indication.
This way, at the right side end of each curve, it is written the signal amplitude in dBs relative to 0dB of my card, as well as the corresponding real value in mVrms.
And this is important for me because I easily forget how weak can a signal be e.g a humble -48db equals 4mV.
At the left side in the area of 20Hz, I have marked on each curve how many dbs rel to 3kHz is this curve down at 20Hz.
As you can see, with this x-former, the smaller the signal, the heavier the drop in LF, (confirmation of the manual bandwidth measurement results).
Can anyone provide a possible explanation for this?
This diagram shows me also how vulnerable can small amplitude signals be to extraneous noise and how important is to properly plan, arrange for and implement a measurement. Here, I have to quote SY
The sad reality of high sensitivity measurement is that it takes almost no time to do the measurement, but a LONG time to set things up properly!
Regards
George
Attachments

Last edited:
Hi george, have you done a loopback measurement on the sound card with the varying drive levels, to check whether or not the difference is the card's frequency response, as opposed to the transformers?
Thanks for the explanation that helps a lot
I had a thought this morning, with respect to the 50Hz problem. I've had similar problems in the past (worse than my current ones) due to earth loops with the PC, and I suddenly thought: "If I had a high quality usb soundcard, I could do all of the measurements on my laptop running off battery, That should completely eliminate any 50 Hz that is coming from the PC, and also will remove the possibility of an earth loop. I might need to revise my Birthday present from a capacitor tester (in circuit ESR meter) to a good USB sound card
Tony.
Oops
I spoted a small mistake on the diagram.
I had marked the odd harmonics of main's 50Hz, but missed the 7th.
Now I corrected it. Sorry
Tony I will do it and report back. Thank you.
May we all have a good and fruitfull new month (June)
Regards
George
I spoted a small mistake on the diagram.
I had marked the odd harmonics of main's 50Hz, but missed the 7th.
Now I corrected it. Sorry
Hi george, have you done a loopback measurement on the sound card with the varying drive levels, to check whether or not the difference is the card's frequency response, as opposed to the transformers?
Tony I will do it and report back. Thank you.
May we all have a good and fruitfull new month (June)
Regards
George
Attachments

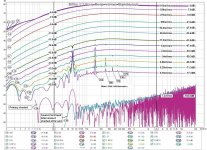
Hi george, have you done a loopback measurement on the sound card with the varying drive levels, to check whether or not the difference is the card's frequency response, as opposed to the transformers?
At your service sir
Tony, as you see, the card’s response is ruler flat.
Signal ranges from +3dB (yes, I overloaded the input a bit to see how it behaved. In this card, the inputs are overload protected by clamp diodes) to –78dB
Note: This is the response of the measuring RH Input channel, which was connected directly to the LH Out .
The LH Input was left open, so there is no compensation or correction of any kind.
This is why the noise from the shorted RH Input is around –90 at 20kHz.
If the LH Input too was connected to LH Out, as is usually done for to make the LH Input channel the “reference”, then the shorted RH Input would be another 30 to 40 dBs lower (around –130dB) at 20kHz.
Regards
George
Attachments
Thanks George, Was worth checking! I spent a heap of time trying to work out why the freq response of my bass reflex enclosure was no where near the sim, it turned out it was because my microphone was damaged (after dropping it). Tried a new mic and the nearfield matched the sim almost perfectly!
The effect is quite subtle, I have no ideas as to what might be causing it.
Tony.
Tony.
The effect is quite subtle, I have no ideas as to what might be causing it.
Tony.
Tony.
Thanks George, Was worth checking!
It HAD to be checked. I had checked it in the past and I was certain that the card was OK, but I had not documented it.
Now it's done properly!
The effect is quite subtle, I have no ideas as to what might be causing it.
After an additional couple of hundrend MB of measurement data and 2 man-days work
, I have gathered enough evidence to target the cause ("Pretty elementary dear W")I'll just
 till tomorrow's daylight.
Regards
George
Ah Tony
I’m 3 days with no baking!
Yesterday morning I went to my lab for “half an hour”.
I ended up doing manual measurements for 10 hours.
In the end I could not gather which probe goes to where. My head was like our economy here par the “cooking”.
I thought to sit and type a few lines as an apology for not being on time on this thread, but I was somehow certain that you guys would had already set your mind that I was fully –arms and legs – into baking, therefore I droped the idea.
I had a couple of beers instead and went straight to bed.
The Wagnerian style “where had you been the last 48 hours?” clinked familiar to my ears.
Today MORNING I’ll do some hours “MS Paint” editing and you’ll have some more nice colourful diagrams, just to add to the confusion.
See you later
I’m 3 days with no baking!
Yesterday morning I went to my lab for “half an hour”.
I ended up doing manual measurements for 10 hours.
In the end I could not gather which probe goes to where. My head was like our economy here par the “cooking”.
I thought to sit and type a few lines as an apology for not being on time on this thread, but I was somehow certain
that you guys would had already set your mind that I was fully –arms and legs – into baking, therefore I droped the idea.I had a couple of beers instead and went straight to bed.
The Wagnerian style “where had you been the last 48 hours?” clinked familiar to my ears.
Today MORNING
I’ll do some hours “MS Paint” editing and you’ll have some more nice colourful diagrams, just to add to the confusion.See you later
Last edited:
Thanks Tony
Here we go (just 16 min past noon)
Again, 20Hz roll-off dBs rel to 3kHz level.
On the right is the signal level entering the Sound Card in dBs relative to 0dB (1286.4mVrms) of my Sound Card
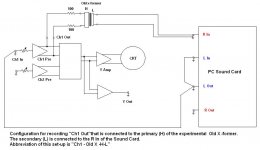
Ch1 Out-Old X-H-L
Here we go (just 16 min past noon
)Again, 20Hz roll-off dBs rel to 3kHz level.
On the right is the signal level entering the Sound Card in dBs relative to 0dB (1286.4mVrms) of my Sound Card
Ch1 Out-Old X-H-L
Attachments
Last edited:
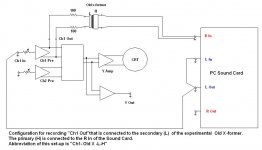
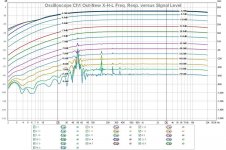


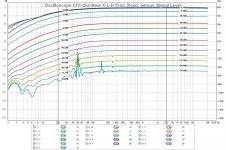
What is seen from all the above new plots (including the one from the 1:1 bifilar in post #28 http://www.diyaudio.com/forums/equipment-tools/189545-implementing-y-out-oscilloscope-3.html#post2590879
is that the LF roll-off drop in dBs btn the 3 x-formers (5 different connection configurations) as well as the difference of LF roll-off drop btn high level and low level signal in each connection configuration, is affected by the secondary load, as reflected back to the primary. The lower the reflected impedance, the more dB drop. (Electric circuit theory predicts this by the way).
As for the 50Hz plus harmonics peaks , I can not propose any relationship btn the peaks amplitude (highest is 36db height, lowest is 15dB) and different configuration, as each measurement was c/out at different time (*PS), although each curve on every diagram is the average of two ~5sec sweep measurements. The less noisy seems to be the “New” x-former, but only simultaneous measurements can confirm this.
The only think that is certain is, that the 50Hz pick-up is due to the x-formers themselves and not from the interconnects. This is shown up to now from curve “C19” in bifilar diagram and from the lower green curve here http://www.diyaudio.com/forums/equipment-tools/189545-implementing-y-out-oscilloscope-3.html#post2591266
It was to be expected, as all these x-formers are of unshielded E-I construction.
Some measurements I’ll show you later, will support this opinion.
Regards
George
<Edit>
*PS 1.That the 50Hz pollution varies with time is manifested by the harmonics. On some diagrams you’ll notice that some harmonics are positive going on one curve, while on an other curve on the same diagram they are negative going.
*PS2. Literature says that the amount of 3rd, 5th and 7th and the relation of their height, is a metric of the load unbalance btn phases on 3phase utility distribution network.
In my lab I have only one phase of 230V and I try to keep the same condition as to the equipment that I operate plus lighting, as well as all the measuring wiring is in the same position (taped to the workbench) during all these experiments.
Last edited:
Hi George, I'm still digesting this information (I'm a bit thick sometimes when it comes to electrical circuit theory)
It is interesting that the 50Hz and harmonics behave the way they do, but as you said test to test is not really comparable (as I have found).. I got some measurements early on with virtually no 50Hz polution and have not been able to replicate
Tony.
(I'm a bit thick sometimes when it comes to electrical circuit theory) It is interesting that the 50Hz and harmonics behave the way they do, but as you said test to test is not really comparable (as I have found).. I got some measurements early on with virtually no 50Hz polution and have not been able to replicate
Tony.
- Status
- This old topic is closed. If you want to reopen this topic, contact a moderator using the "Report Post" button.
- Home
- Design & Build
- Equipment & Tools
- Implementing a “Y Out” on an Oscilloscope