New version
Hi Demian,
The horizontal scale (time base) and vertical scale (gain) are easily adjusted with the left or right cursor keys, respectively with the up or down cursor keys. Note: This only works if the mouse cursor has been moved to the lower pane first.
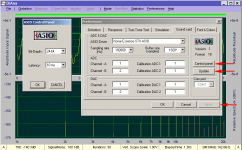
As for the ACP, a new button -update- has been added (see 1st pic). This button becomes active after launching the ACP or when the ACP is closed again (depending on the actual implementation of the ACP, as they all behave differently!). After clicking on this button and settings have changed, the apply button becomes active, click on the apply button to save the new settings.
As for the calculation of the SNR, a different route has been followed: First, a moving average is constructed in such way to differentiate between meaningful spectral lines (e.g. harmonics) and just noise. Then, only the "noise bins", that is, the spectral lines below the moving average, are integrated except in the region around the fundamental frequency (f0), which might contain phase noise components. This region is (currently) defined as 0.5 * f0 to 1.5 * f0. The power of these "fundamental bins" is skipped and replaced by the mean power value of the moving average.
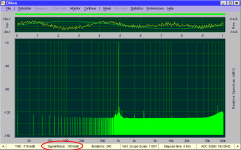
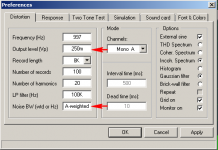
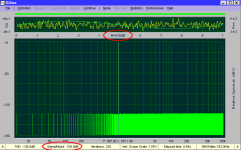
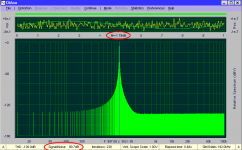
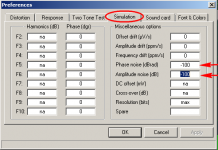
A simulate test shows very favorable results. See pic-2 for setup, pic-3 for the uncleaned raw spectrum and pic-4 for the cleaned-up spectrum: exactly 100.0dB SNR, just as specified in the menu (btw, how to get an uncleaned spectrum I will tell another time).
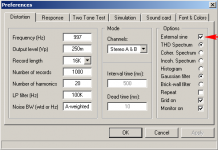
Also the SNR of the Lynx L22 is finally well in accordance with the specs, see pic-6. Note that the Distortion menu is altered: the "radio buttons" internal sync and external sync are replaced by a single check box: external sine. Also note that the A-weighted noise bandwidth (simply type a or b or c), see pic-5.
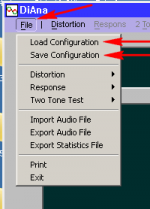
As for the "profiles", the ini files concerned can be simply saved or loaded under appropriate names via the file menu, see pic-7.
Cheers, E.
PS: I've emailed the new version to you.
Hi Demian,
We were at cross-purposes. I thought you was talking about the curves in the upper pane. That wasn't the case. Instead, you meant the lower monitor (oscilloscope) pane. Right? My apologies for the confusion.Back at the testing-deleted ini file. Then discovered that the numbers in statistics are peak. Went and converted and recalibrated for peak instead of RMS. Still the lower display is locked at 1V so big signals are off scale and small ones too small to see.
The horizontal scale (time base) and vertical scale (gain) are easily adjusted with the left or right cursor keys, respectively with the up or down cursor keys. Note: This only works if the mouse cursor has been moved to the lower pane first.
Well, yes, of course I could (optionally) convert the scale to dBFS. But wouldn't that lead to even more confusion, as there are so may dB's: dB, dBv, dBV, dBu, etc? Let me think about it.It would be great to have sine conversion and dBFS displayed at the setting menu for the level and some help for the calibration process. Currently I'm trial and error to get the cal factors correct. I'm now within 1% so I won't sweat it.
This feature was already implemented last week, but there were more issues: The ASIO control panel (ACP) and -in case of some phase noise of the sine source- faulty readings of the SNR . Both functions are completely re-written (hence the delay).Let me know when the preferences version is ready to try.
As for the ACP, a new button -update- has been added (see 1st pic). This button becomes active after launching the ACP or when the ACP is closed again (depending on the actual implementation of the ACP, as they all behave differently!). After clicking on this button and settings have changed, the apply button becomes active, click on the apply button to save the new settings.
As for the calculation of the SNR, a different route has been followed: First, a moving average is constructed in such way to differentiate between meaningful spectral lines (e.g. harmonics) and just noise. Then, only the "noise bins", that is, the spectral lines below the moving average, are integrated except in the region around the fundamental frequency (f0), which might contain phase noise components. This region is (currently) defined as 0.5 * f0 to 1.5 * f0. The power of these "fundamental bins" is skipped and replaced by the mean power value of the moving average.
A simulate test shows very favorable results. See pic-2 for setup, pic-3 for the uncleaned raw spectrum and pic-4 for the cleaned-up spectrum: exactly 100.0dB SNR, just as specified in the menu (btw, how to get an uncleaned spectrum I will tell another time).
Also the SNR of the Lynx L22 is finally well in accordance with the specs, see pic-6. Note that the Distortion menu is altered: the "radio buttons" internal sync and external sync are replaced by a single check box: external sine. Also note that the A-weighted noise bandwidth (simply type a or b or c), see pic-5.
As for the "profiles", the ini files concerned can be simply saved or loaded under appropriate names via the file menu, see pic-7.
Cheers, E.
PS: I've emailed the new version to you.
Attachments
Last edited:
I think this could be the go to for electronic measurements pretty soon. The details that aren't ideal are similar to ones that are never fixed in some of the competitive solutions.
As for PNP, The AP is hardly easy to use and the current generation is harder that earlier ones. The premium commercial applications tend to be incredibly pricey (e.g. Listen or NI) and you need a two week class to get anything useful from them. For me this makes the RTX almost the equivalent of the Shibasoku + Waveform monitor and FFT. and the residuals of the RTX are all close to -130 dB which is close to where even the Shibasoku loses accuracy.
As for PNP, The AP is hardly easy to use and the current generation is harder that earlier ones. The premium commercial applications tend to be incredibly pricey (e.g. Listen or NI) and you need a two week class to get anything useful from them. For me this makes the RTX almost the equivalent of the Shibasoku + Waveform monitor and FFT. and the residuals of the RTX are all close to -130 dB which is close to where even the Shibasoku loses accuracy.
Jitter
Hi Demian,
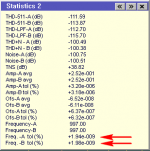
Yes, it can, provided that the external synchronization is enabled (see pic 1). At the bottom of the statistics-2 page the RMS value of the jitter as a percentage of the nominal frequency is shown (see pic 2). BTW, these figures cover the Lynx L22.
Note that the outcome depends on the Record length (in this case 16k). Also note that in this particular case, where the ADC and DAC share the same clock, the shown jitter figures don't represent the real clock jitter, rather the jitter as a result of amplitude noise (the lower the signal level, the higher the apparent jitter).
Cheers, E.
1audio said:Can your software measure the frequency stability of a sine wave? I would think that would come as a side effect of the basic measurement process. I don’t think it would be an indication of jitter in the system unless its pretty severe. But it may highlight something.
Hi Demian,
Yes, it can, provided that the external synchronization is enabled (see pic 1). At the bottom of the statistics-2 page the RMS value of the jitter as a percentage of the nominal frequency is shown (see pic 2). BTW, these figures cover the Lynx L22.
Note that the outcome depends on the Record length (in this case 16k). Also note that in this particular case, where the ADC and DAC share the same clock, the shown jitter figures don't represent the real clock jitter, rather the jitter as a result of amplitude noise (the lower the signal level, the higher the apparent jitter).
Cheers, E.
Attachments
PnP
Hi Richard,
DiAna was PnP, but not on every PC (because it was too slow, the registry was corrupted, driver issues, etc.) Also lack of extensive documentation led to some confusion.
Last but not least, on request from several users, a number of new features were implemented, which had to be debugged and/or refined. That's what going on here.
To some extent you might compare the development of DiAna with the RTX6001, which also (partly) relies on ideas and requests from the diyaudio community.
Cheers, E.
PS: I almost forgot to mention the "false positives" from some silly virus scanners, that also contributed to troubles.
Hmmm. Doesn't seem it is PnP ready for me, yet. My meaning is .... not everything works perfectly and no issues. But, I am sure you will get there... watching with interest.
THx-RNMarsh
Hi Richard,
DiAna was PnP, but not on every PC (because it was too slow, the registry was corrupted, driver issues, etc.) Also lack of extensive documentation led to some confusion.
Last but not least, on request from several users, a number of new features were implemented, which had to be debugged and/or refined. That's what going on here.
To some extent you might compare the development of DiAna with the RTX6001, which also (partly) relies on ideas and requests from the diyaudio community.
Cheers, E.
PS: I almost forgot to mention the "false positives" from some silly virus scanners, that also contributed to troubles.
[...]
It would be great to have sine conversion and dBFS displayed at the setting menu for the level .....
[...]
I'm not sure what you mean exactly by that. Perhaps dB's or dBFS's for the vertical scale of the oscilloscope display (in the lower pane), instead of volts?
Cheers, E.
I think this could be the go to for electronic measurements pretty soon. The details that aren't ideal are similar to ones that are never fixed in some of the competitive solutions.
As for PNP, The AP is hardly easy to use and the current generation is harder that earlier ones. The premium commercial applications tend to be incredibly pricey (e.g. Listen or NI) and you need a two week class to get anything useful from them. For me this makes the RTX almost the equivalent of the Shibasoku + Waveform monitor and FFT. and the residuals of the RTX are all close to -130 dB which is close to where even the Shibasoku loses accuracy.
The AP 2722 is so broad in its capabilities that a 500 page manual exists. From that I can almost figure out how to do multi-tone tests or whatever. But, it is a night mare for just the basic tests I (most) would start with.... HD, IM, FFT etc.
The Panasonic HD/IM instruments are bullet proof... no software issues, all in one package. But it is large and heavy. But, very nice to use.... just push a button on front panel. Accurate to -130dbv.
The ShibaSoku 725D is well within 1 dB accuracy on any harmonic down to -130. I tested and verified it. You can add a QA400/01 to the monitor port and do FFT on residual at mon. port. This use of FFT on monitor port extends the instrument to -160dbV.
the monitor port is a calibrated output at 1v FS on any range. Same as for Panasonic. Not calibrated on monitor out from AP. The dbr and dbv are required IMO.
The source generator HD is important at low HD testing and might be nice to have internal subtraction of gen HD (stored in file) and data from DUT subtracted automatically.
Nice project -- Oh and what are the prices?
THx-RNMarsh
Last edited:
I'm not sure what you mean exactly by that. Perhaps dB's or dBFS's for the vertical scale of the oscilloscope display (in the lower pane), instead of volts?
Cheers, E.
I was thinking that in the setting menu you could take the input as V peak (or preferably Vrms) and show how that relates to the current device sensitivity in Vpeak and dBFS (peak). This and possibly in statistics show the RMS as well as Vpeak. These are where the confusion is most likely to cause errors. Its just a simple number conversion in text fields.
Before digital all AC measurements related back to RMS. That was (and still is) that the most accurate way to measure AC is its heating value. Everything else derives from that. With digital sampling the peak values become the most direct and basic measurement and rms become a calculation. To some degree this is an issue of where we come from and our experience.
BTW, I fully agree with that, see: uTracer...[...]
Before digital all AC measurements related back to RMS. That was (and still is) that the most accurate way to measure AC is its heating value. Everything else derives from that. With digital sampling the peak values become the most direct and basic measurement and rms become a calculation. To some degree this is an issue of where we come from and our experience.
")
Cheers, E.
Last edited:
W10-LTSB vs W10-Enterprise
Hi Chris,
Using Windows 10 LTSB appears to be a big mistake (I already called it the worst OS ever). But today I've installed W10-Enterprise and guess what: This version performs way better, much faster and responsive. Also, it is not perpetual busy with update rubbish and occupying 50% of the CPU. A great improvement.
Cheers, E.
[...]
For those who dislike the Windows store stuff, I'd recommend you download Windows 10 LTSB and activate it with a KMS activator if you are comfortable doing that. I'd recommend you just buy it, but you can't buy it without a volume license agreement.
Hi Chris,

I did just that.
Cheers, E.
Hi Chris,
Using Windows 10 LTSB appears to be a big mistake (I already called it the worst OS ever). But today I've installed W10-Enterprise and guess what: This version performs way better, much faster and responsive. Also, it is not perpetual busy with update rubbish and occupying 50% of the CPU. A great improvement.
Cheers, E.
I have no problem with LTSB, I use enterprise at work as well and they perform exactly the same. There was something obviously wrong with your previous installation. Glad that you no longer have the problem though.
W10-LTSB
Do you have a regular version of W10-LTSB or a bootleg version with a KMS activator ? (I was using the latter)
Cheers, E.
Hi Chris,I have no problem with LTSB, I use enterprise at work as well and they perform exactly the same. There was something obviously wrong with your previous installation. Glad that you no longer have the problem though.
Do you have a regular version of W10-LTSB or a bootleg version with a KMS activator ? (I was using the latter)
Cheers, E.
Hi Edmond,
As far as I know, you can still activate a WIN10 if you have a valid WIN7 license. No need to use bootleg versions.
Btw. Looks to be a nice piece of software that I plan to check out when time permits and I get my RTX analyzer out of the box. However, even though I have been a Windows user for many years, I switched to Linux 5 years ago, as work situation required it. Never looked back. As a developer it fits my needs much better. But, I will get my WIN10 machine dusted
Cheers,
Mogens
Hi Edmond,
As far as I know, you can still activate a WIN10 if you have a valid WIN7 license. No need to use bootleg versions.
LTSB is an Enterprise volume-license-only product, so you can't purchase it or use a Windows 7 key to get it.
Edmond - I used KMS to activate it but the ISO I installed from was from Microsoft directly.
@Mogens: W10-LTSB is a different story.
Hi Edmond,
I'm aware of this. I was just finding it strange that you relied on a W10 enterprise version that for most people can only obtain as a bootleg version.
Anyways, I look forward to try out your software.
Cheers,
Mogens
version 1.48.9
Hi Mogens and all others who are interested,
I've just uploaded version 1.48.9. New features are included as described here.
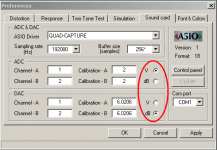
In addition, cal. values can also be entered in dB, see pic.
After installing a new version, the old ini file is most of the time not valid any longer. In this case, as usual, default parameter are loaded. But in the new version, also the old ini file is deleted automatically, instead of just updated. Nevertheless, it's better to delete the old ini file in advance anyhow. Better safe than sorry.
Good luck.
Cheers, E.
edit: Opposed to previous version, also under W10, DiAna is visible in the so called alt-tab list.
Hi Edmond,
[...]
Anyways, I look forward to try out your software.
Cheers,
Mogens
Hi Mogens and all others who are interested,
I've just uploaded version 1.48.9. New features are included as described here.
In addition, cal. values can also be entered in dB, see pic.
After installing a new version, the old ini file is most of the time not valid any longer. In this case, as usual, default parameter are loaded. But in the new version, also the old ini file is deleted automatically, instead of just updated. Nevertheless, it's better to delete the old ini file in advance anyhow. Better safe than sorry.
Good luck.
Cheers, E.
edit: Opposed to previous version, also under W10, DiAna is visible in the so called alt-tab list.
Attachments
Last edited:
- Home
- Design & Build
- Equipment & Tools
- DiAna, a software Distortion Analyzer