I was wrong, but not by much. I just checked with an HP3428 milliOhmmeter and a 20 AWG copper wire at room temperature 20 MM long is 1 milliOhm. The HP uses AC to make the measurement and measures only the real part of the resistance. At these low levels DC errors can dominate the measurement which is why its AC. Yopu could use the 2 CM of 20 AWG wire as a test for the system.
Even with a proper kelvin connection I doubt the active circuit can be that low across that band. The inductance would dominate pretty quickly as I have discovered to my dismay. I built a 100 dB 50 Ohm attenuator that used .5 milliOhms of wire for the output resistance. Turns out a straight wire in that form will have enough inductance to get an HF boost which made for problems verifying an RIAA network. It was an interesting learning experience.
Even with a proper kelvin connection I doubt the active circuit can be that low across that band. The inductance would dominate pretty quickly as I have discovered to my dismay. I built a 100 dB 50 Ohm attenuator that used .5 milliOhms of wire for the output resistance. Turns out a straight wire in that form will have enough inductance to get an HF boost which made for problems verifying an RIAA network. It was an interesting learning experience.
As long as I have checked, 10A fuse for battery protection is 10 milliohms, and a connector capable of 10A is about 20 milliohms or more. Total DC resistance with wire from a battery to the power amplifier can't be less than 50 milliohms. Battery impedance itself is usually neglectable. FET impedance is easily less than a connector even if you use a small one(2sj130). I'm sure the dominating factor is wire.
The "Power Supply Output Impedance Measurement" on MI-Pro contains a sample device test plan which can be used to measure the power supply output impedance in a frequency range from 1Hz to 100kHz at a step of 1/3 octave. It contains three Panel Setting Files (PSF) and one DTP file.
Three PSF files are thus created for 1Hz~10Hz (10s), 10Hz~100Hz (1s), and 100Hz~100kHz (100ms) respectively. They are:
1. PowerSupplyOutputImpedanceMeasurement10s.psf
2. PowerSupplyOutputImpedanceMeasurement1s.psf
3. PowerSupplyOutputImpedanceMeasurement100ms.psf
I can't see what these files contains inside but from the .dtp file that loaded into Device Test Plan, I can't see something special that compensate the length of cabling
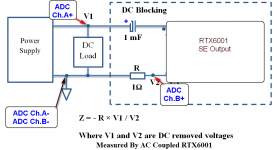
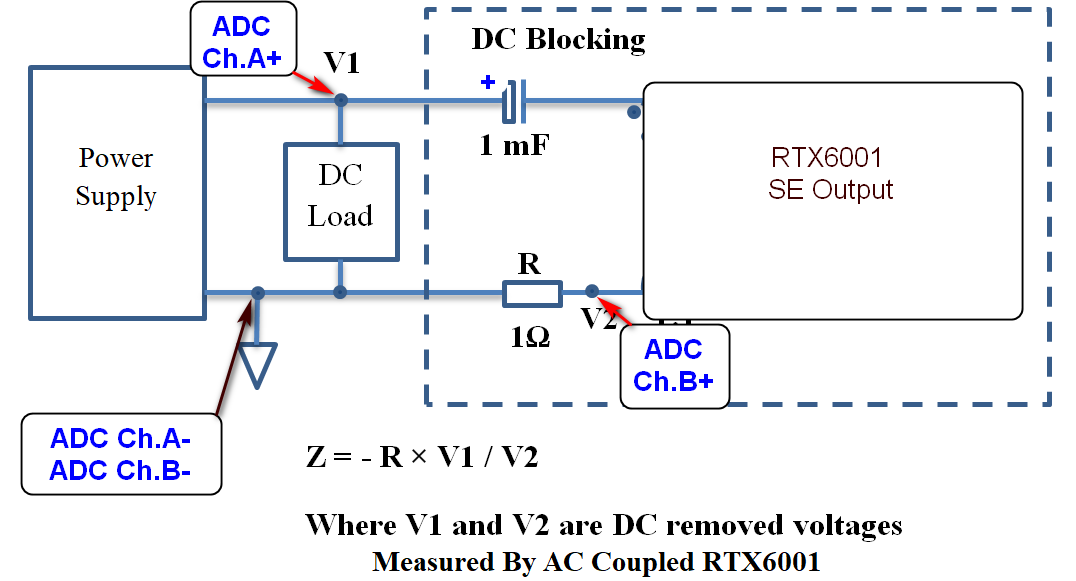
Then, the Zo calculate from the formula: UDDP1 (Impedance): 1*[f1RMS_A(EU)]/[f1RMS_B(EU)].
RMS_A(EU) and RMS_B(EU) are total RMS values calculated by the oscilloscope. f1RMS_A(EU) and f1RMS_B(EU) are the RMS values of the highest peak frequency calculated by the spectrum analyzer (therefore nearly all noises are excluded).
I am not expert about all these, of course more information Virtins could be share with us...
The diagram that I used for the Zo measurement is attached.
The AC injection is always the 10-15% of PSU Load, ie 100mΑ testing load = 10-15mA of AC input signal.
Three PSF files are thus created for 1Hz~10Hz (10s), 10Hz~100Hz (1s), and 100Hz~100kHz (100ms) respectively. They are:
1. PowerSupplyOutputImpedanceMeasurement10s.psf
2. PowerSupplyOutputImpedanceMeasurement1s.psf
3. PowerSupplyOutputImpedanceMeasurement100ms.psf
I can't see what these files contains inside but from the .dtp file that loaded into Device Test Plan, I can't see something special that compensate the length of cabling
Code:
1
Editable
16
Step,
Description,
Instruction,
Duration(s),
Delay(s),
A-Waveform,
A-Frequency(Hz),
A-Amplitude(V),
B-Waveform,
B-Frequency(Hz),
B-Amplitude(V),
PhaseDifference(D),
A-DC(V),
B-DC(V),
Impedance(Ohms),UDDP1(UU)
Phase(Degree),UDDP2(UU)
1,Displaytitleon{[Panel3]},LOG,PowerSupplyOutputImpedanceTest,,,,,,,,,,
2,Displaysubtitleon{[Panel1]},LOG,1Hz~100kHz,,,,,,,,,,
3,Initializethestartingoutputfrequency:0.976562498Hz,OPT,x1,=0.976562498,,,,,,,,,
4(REPEAT),Displaythecurrentoutputfrequencyinpurpleon{[Panel2]'255,0,255'},LOG,,x1,Hz,,,,,,,,
5,Ifoutputfrequency<10Hz,gotosteplabelled(1HZ),CHK,x1,<,10,(1HZ),,,,,,,
6,Ifoutputfrequency<100Hz,gotosteplabelled(10HZ),CHK,x1,<,100,(10HZ),,,,,,,
7,Ifoutputfrequency<=100000Hz,gotosteplabelled(100HZ),CHK,x1,<=,100000,(100HZ),,,,,,,
8,Jumptosteplabelled(END),JMP,(END),,,,,,,,,,
9(1HZ),LoadPanelSetting(1Hz<=outputfrequency<10Hz),LDP,psf\PowerSupplyOutputImpedanceMeasurement10s.psf,,,,,,,,,,
10,Outputthecurrentfrequencyandsampleitattheinputsimultaneously,SIO,12,0,01,x1,10,01,x1,10,0,0,0
11,Increaseoutputfrequencyby1/3octave:2^(1/3)=1.25992105,OPT,x1,*1.25992105,,,,,,,,,
12,JumptoStep(REPEAT),JMP,(REPEAT),,,,,,,,,,
13(10HZ),LoadPanelSetting(10Hz<=outputfrequency<100Hz),LDP,psf\PowerSupplyOutputImpedanceMeasurement1s.psf,,,,,,,,,,
14,Outputthecurrentfrequencyandsampleitattheinputsimultaneously,SIO,2,0,01,x1,10,01,x1,10,0,0,0
15,Increaseoutputfrequencyby1/3octave:2^(1/3)=1.25992105,OPT,x1,*1.25992105,,,,,,,,,
16,JumptoStep(REPEAT),JMP,(REPEAT),,,,,,,,,,
17(100HZ),LoadPanelSetting(100Hz<=outputfrequency<=100000Hz),LDP,psf\PowerSupplyOutputImpedanceMeasurement100ms.psf,,,,,,,,,,
18,Outputthecurrentfrequencyandsampleitattheinputsimultaneously,SIO,0.2,0,01,x1,10,01,x1,10,0,0,0
19,Increaseoutputfrequencyby1/3octave:2^(1/3)=1.25992105,OPT,x1,*1.25992105,,,,,,,,,
20,JumptoStep(REPEAT),JMP,(REPEAT),,,,,,,,,,
21(END),End,END,,,,,,,,,,,
#
1936,1056,96,96
1,1,7,1025,30,230
0,0,0,0,0
1,1.000000,100000.000000,0.000000,2.000000,6,14,1,0,1,0,0,0,0,0,0,7f,7f7f,7fff,ffff,7f7fff,2,1030,229,619
,
,
,
,
,
,
,
,
,
,
1,1.000000,100000.000000,-180.000000,180.000000,6,15,1,0,1,0,0,0,0,0,0,7f,7f7f,7fff,ffff,7f7fff,2,1030,611,1000
,
,
,
,
,
,
,
,
,
,
0,0.000000,1.000000,0.000000,1.000000,0,0,0,0,1,0,0,0,0,0,0,7f,7f7f,7fff,ffff,7f7fff,0,0,0,0
,
,
,
,
,
,
,
,
,
,
0,0.000000,1.000000,0.000000,1.000000,0,0,0,0,1,0,0,0,0,0,0,7f,7f7f,7fff,ffff,7f7fff,0,0,0,0
,
,
,
,
,
,
,
,
,
,
0,0.000000,1.000000,0.000000,1.000000,0,0,0,0,1,0,0,0,0,0,0,7f,7f7f,7fff,ffff,7f7fff,0,0,0,0
,
,
,
,
,
,
,
,
,
,
0,0.000000,1.000000,0.000000,1.000000,0,0,0,0,1,0,0,0,0,0,0,7f,7f7f,7fff,ffff,7f7fff,0,0,0,0
,
,
,
,
,
,
Then, the Zo calculate from the formula: UDDP1 (Impedance): 1*[f1RMS_A(EU)]/[f1RMS_B(EU)].
RMS_A(EU) and RMS_B(EU) are total RMS values calculated by the oscilloscope. f1RMS_A(EU) and f1RMS_B(EU) are the RMS values of the highest peak frequency calculated by the spectrum analyzer (therefore nearly all noises are excluded).
I am not expert about all these, of course more information Virtins could be share with us...
The diagram that I used for the Zo measurement is attached.
The AC injection is always the 10-15% of PSU Load, ie 100mΑ testing load = 10-15mA of AC input signal.
Attachments
That measurement setup seems sensible. I know from experience that you can reliably measure below 1mOhm, but only at lowish frequencies. The impedance will invariably rise above a few kHz due to drop in loop gain of the error amp.
I would do it slightly differently; I would insert a controlled current into the output and then measure the residual, using Ohm's law to calculate Zout. Not using the 1 Ohms as reference, so any connection-resistance that would add to the 1 Ohms have no effect.
For instance, there are two currents flowing in the ground connection between the 'bottom' of the DC load and the ground point of the measurement probes; one current from the load, one from the 1 Ohms. So do these currents add, or subtract? It is a confounder.
Jan
Last edited:
If you are using the single ended output you need to be sure there is no hiddent parallel ground path. remove the 1 ohm resistor and measure the DCR between the marked ground and the BNC shell on the RTX. The BNC is tied to power ground I believe to meet safety requirements.
- Sure, this setup goes reliable to the lower frequencies against to the high upper frequencies.
- The inserted AC stimulus current is controlled by the software, you can change each time the amount of AC current (at the .dtp file) that inserted at the output.
- I don't know the exact role of 1 Ohm resistor. I think, that this is a common diagram to many related documents. Usually, they insert a transformer at the signal output to break any continuity. I don't use any transfo, but I care to lift any power gnd from my measurement setup, usually (to break any gnd loops).
- The 200K ADC input and the differential input measurement, are the positive of this setup and probably minimized the effect of cable length.
If you are using the single ended output you need to be sure there is no hiddent parallel ground path. remove the 1 ohm resistor and measure the DCR between the marked ground and the BNC shell on the RTX. The BNC is tied to power ground I believe to meet safety requirements.
Demian, I remember that the same you have told me before...to the "GB for Virtins MI Pro for RTX6001 autoranging/autoscaling & for soundcard end users" thread.
For this reason, I have made a lift gnd on AC sockets that connects the RTX, Electronic Load and Lab PSU.
Each time that I have to measure a Zo or PSRR on a PSU, I lift the gnd from these AC-sockets.
The 1 Ohm resistor is the current sampling point. You are measuring the voltage across it as representative of the current into the load (Va). The voltage across the load (Vb) is the other part of the equation. The amplitude and phase relationship converts to the impedance in VI, Vb (E)/Va (I)= R. You should check the resistance R with a meter to make sure that it is 1 Ohm in circuit and that you are measuring differentially. Testing a reference resistor of around the same value is very helpful in validating the measurement.
The resistor has measured by a DEREE LCR meter and is 0.999-1.000 Ohm
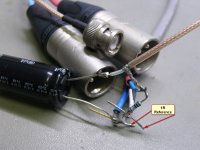
The diagram as told before is the following:
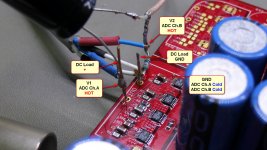
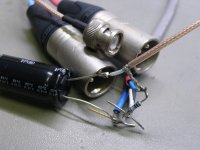
The attached photos are the connection on PSU output for Zo measurement and a photo of cable with the connectors.
The diagram as told before is the following:
The attached photos are the connection on PSU output for Zo measurement and a photo of cable with the connectors.
Attachments
Hi Demian,
I took an 1R resistor that the LCR DER-EE DE-5000 measured:
100Hz..... 1.01R
120Hz.... 1.00R
1KHz..... 1.006R
10KHz.... 1.007R
100KHz... 0.996R
This resistor set between two OFC terminals of my cable setup like photo attached.
If this is what you want, the Zo measurement was from 20-20000Hz to 1.0019 Ohm with upper at the 1.0022 Ohm of 85KHz.
If this test was right, I think must repeat with real reference resistor for valid results.
Attachments
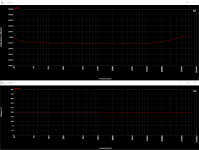
That measurement looks good except the phase is reversed. Swap one pair of differentials going to the RTX so the phase is 0 degrees across the measurement range. Then take about 20 cm of 20 to 24 AWG copper wire in a tight loop to get something in the 10 milliOhm range (I got about 8 milliOhms for 20 CM of 24 AWG copper at room temperature) and make sure its still around 0 degrees and much smaller than the 1 Ohm resistor. If a and b are swapped you will get 100 ohms instead of 10 milliOhms.
I have been dealing with this for years measuring driver impedance and always need to go through these checks to get everything right. (8 connections mean 8 factorial ways to get them wrong. I have done all of those) If its not fixed like the DER there are many ways to get confused. These simple checks ensure the measurements will be accurate.
I have been dealing with this for years measuring driver impedance and always need to go through these checks to get everything right. (8 connections mean 8 factorial ways to get them wrong. I have done all of those) If its not fixed like the DER there are many ways to get confused. These simple checks ensure the measurements will be accurate.
I am still working on an alternative power supply, replacing the toroidal transformer with a switch mode supply board + an external adapter. I hope to get PCB's back from manufacturing (bare boards) next week. These are for those users who don't like the mains hum at around -150 dBV. The test version of the supply got the mains hum down below the noise floor, which is around -168 dBV (with a 512k FFT).
Any news on this?
The progress has been rather slow due to parallel projects and other obligations.
But your question did make me decide to speed it up. I have almost completed a couple of boards and expect to de some initial testing this week.
sweet

- Home
- Design & Build
- Equipment & Tools
- DIY Audio Analyzer with AK5397/AK5394A and AK4490