Hi Dick,
Just before receiving your note I had a similar revelation, how does the spectrum analyzer know what the level of the fundamental is if I'm sending it to the analyzer nulled? The analyzer must be using something like 1 Vrms as 0dB. So, when I turn the volume nob up or down it's looking at the harmonics against this fixed assumption on input voltage. So, I need to figure out what reference voltage it's using for 0dB and then set the signal sources to that level for future tests or figure out how to have the anlayzer use what ever the un-nulled fundamental voltage is as 0dB. Does this methodolgy make sense? I need to crack the manual open and have a look.
Ken
Methodology makes sense.
The common level references are:
0dBV = re 1VRMS = voltage level
0dBm = re 1mW into spec'd Z; typ. 775mVRMS into 600 ohms = power level
0dBu = re 775mVRMS into a high impedance = voltage level
HP has used dBV and dBM (600 ohms) variously for audio and spectrum analyzers, but watch out for dBm (50 ohms or 75 ohms) for many units depending on application.
Methodology makes sense.
The common level references are:
0dBV = re 1VRMS = voltage level
0dBm = re 1mW into spec'd Z; typ. 775mVRMS into 600 ohms = power level
0dBu = re 775mVRMS into a high impedance = voltage level
HP has used dBV and dBM (600 ohms) variously for audio and spectrum analyzers, but watch out for dBm (50 ohms or 75 ohms) for many units depending on application.
Hi Dick,
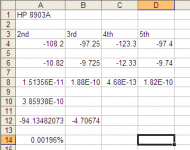
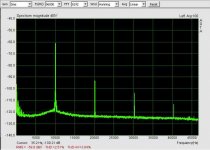
I set the output to 1Vrms and the spectrum analyzer scale read approximately 0dB. So, with the output at 1 Vrms at 10kHz I nulled the fundamental by about 60dB and got the following spectrum plots for the 4402B and the second one for the 8903A.
To get the full spectrum to plot, I will have to tweak my VEE program. That will take a few days.
What do you think about the results?
Ken
Attachments
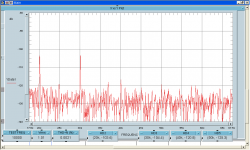
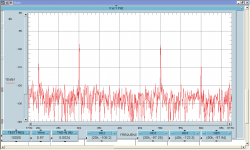
About what I would expect from the 4402B at 10kHz, and the 8903 is worse than I expected.
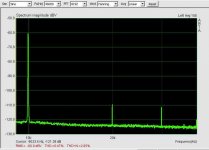
See below the comparable 1VRMS @ 10kHz spectrum (up to 40kHz -- as high as my computer can see) for my HP 239A -- the fundamental is at -60dB re the 1V input. (I rescaled the spectrum to dBV)
Note that the calculated THD of about 0.5%, re the -60dB fundamental, fairly accurately reflects the RMS sum of the visible harmonics, roughly 0.0006%
Attachments
Last edited:
On the 4402B, check the DC voltage at TP4, and adjust R145 to get 0VDC (the allowable range at TP4 is +/-1VDC -- that's a lot). Small changes here may have an affect on the residual THD.
As to the 8903A, I'm not sure that there is anything you can do -- looks like the oscillator and its AGC either work or they don't....
For comparison, I've attached the spectrum of my State-Variable Cordell oscillator at 10kHz and 0dBV -- 0.0025% -- worse than your 8903A.
As to the 8903A, I'm not sure that there is anything you can do -- looks like the oscillator and its AGC either work or they don't....
For comparison, I've attached the spectrum of my State-Variable Cordell oscillator at 10kHz and 0dBV -- 0.0025% -- worse than your 8903A.
Attachments
Hi Dick,
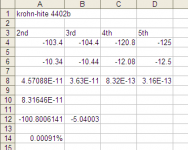
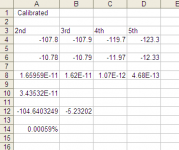
I found the adjustment as you described in the manual. I think the tolerance is +-0.1V I got it down to 0.015V. The 2nd and third improved. I also figured out how to get the spectrum analyzer to average the values, instead of just getting a snap shot at a specific instant. Here are the new calibrated values for the 4402b.
Ken
Attachments
Much better but still a long way from the spec and typical values that K-H list.
Have you checked the accuracy and linearity of the analyzer's amplitude scale? I would definitely do that -- you need a known good attenuator with 10dB or 20dB steps plus maybe an additional fixed attenuator of say 40 or 60dB to give you the dynamic range. I don't remember the attenuation available in the 8903, but it or the 4402B may have sufficiently accurate attenuation to do the job for your 80dB range analyzer.
The issue here is about potential compression of the amplitude range near the bottom of the displayed range so that the displayed products are actually lower than displayed values. Back in the day I used both an HP 3580 and 3581 and had to do a very careful alignment of each to get accurate results, and still had to be careful with the 3580 about products showing up that had much lower amplitudes than seen in the display.
Just a thought.
Hi Dick,
I have a stepped attenuator that I can measure with the 8903a so that I have known values. Are you suggesting that first set the input to the signal analyzer to 0dB and then attenuate the signal by around 80db (with a known or verified attenuation value) and see if the analyzer shows this same value of attenuation?
Ken
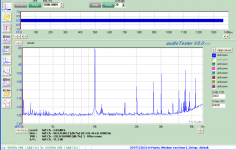
I hooked up the K-H 4402B to my computer sound card this morning through Pete Millett's sound card adapter. I have the Juli@ card in the balanced mode and didn't have an adapter from the BNC to Balance, so, went through the adapter instead. I adjusted it as close to 0dB as I could, but, when I got close, the 3rd harmonic started to rise up in an unusual way. I just remembered that their is an adjustement I have to make in the software. The results are shown below.
I also tried it with the Twin-T, but, it didn't seems very happy. I will look into the Arta software and a BNC to Balance cable.
The other piece of news is that the K-H did not measure as well this morning on the 3562A as it did yesterday. The adjustments don't seem to hold. There are a few electrolitic caps in the unit, maybe they are at the end of their life. The unit manufacture date is 1997.
Ken
Attachments
RE post #50: Yep.
RE post #51: I'm not familiar with Millet's adapter -- is it described here at DIYAudio? Intrinsically, for balanced inputs you just ground one of the inputs and feed signal into the other one.
The Juli@ card looks interesting to me; I think it and the ARTA software should be a good match. ARTA is free to use with no time limit in demo mode with very few restrictions -- you just can't save setups and a few other things. Highly recommended. The AudioTester app has a nice display and obviously lots of options -- I'll take a look at their page. The amount of spurious stuff in the plot is troubling, as is the rise in the noise floor above 40kHz -- I can't really come up with a reason for these artifacts. A sharp rise in 3rd H. should be accompanied with a similar but even sharper rise in 2nd if the issue is dynamic range of some part of the gain chain.
Last edited:
RE post #50: Yep.
RE post #51: I'm not familiar with Millet's adapter -- is it described here at DIYAudio? Intrinsically, for balanced inputs you just ground one of the inputs and feed signal into the other one.
The Juli@ card looks interesting to me; I think it and the ARTA software should be a good match. ARTA is free to use with no time limit in demo mode with very few restrictions -- you just can't save setups and a few other things. Highly recommended. The AudioTester app has a nice display and obviously lots of options -- I'll take a look at their page. The amount of spurious stuff in the plot is troubling, as is the rise in the noise floor above 40kHz -- I can't really come up with a reason for these artifacts. A sharp rise in 3rd H. should be accompanied with a similar but even sharper rise in 2nd if the issue is dynamic range of some part of the gain chain.
So, I tested the signal analyzer up to about -91db. Past that point the next step in the attenuator was 20db and the 8903 ran out of gas. The analyzer and the 8903 matched within +-0.7 dB on two test. I think the 4402b is in need of a serious tune up. When in the 1k to 10k (1k x) range and trimmed for .1v at 1k then moved to 10k the trim is out of tolerance. When I put it in the 10k x range the lowest reading I get is 25kHz. So, either bad resistors or caps for this range. Will measure in the next few days.
Pete's adapter is in the Tube forum. I'll find the link... I haven't been able to master AudioTester's calibration. Arta seems worth a try. I believe the noise at 40k and beyond is the switchmode supply in the computer. As it is, I unplug my monitor before running the test otherwise you would see two off scale spikes at about 44 and 46 kHz.
I've decided that the rise in the third harmonic came from overloading the adapter which was set in the 2v range and has diode voltage limiters. I think the voltage was at about 2.3Vrms when I was trying to get 0db AT.
Seems like the bug squashing is working out -- good luck on the 4402B fix.
Thx for the tip on the monitor noise. I've had noise in the 44kHz range as well, but it didn't seem to be the computer -- I hadn't thought of the monitor -- I'll try turning it off once measurements are set up....
Thx for the tip on the monitor noise. I've had noise in the 44kHz range as well, but it didn't seem to be the computer -- I hadn't thought of the monitor -- I'll try turning it off once measurements are set up....
Here's the link for Pete's soundcard interface:
http://www.diyaudio.com/forums/tubes-valves/155405-test-measurement-interface-soundcard.html#post1987908
http://www.diyaudio.com/forums/tubes-valves/155405-test-measurement-interface-soundcard.html#post1987908
I tried again on Pmillet's links and they all worked this time.
A few minutes ago I tried them and three out of four were "no service available". When I re-tried the working one, it too reported "no service available".
Can anyone explain why links drop out and come back without apparent reason?
A few minutes ago I tried them and three out of four were "no service available". When I re-tried the working one, it too reported "no service available".
Can anyone explain why links drop out and come back without apparent reason?
Looks like the Juli@ will go to 90kHz. First plot is a 1kHz signal, 2nd an 80kHz and third a 90khz signal all at a similar amplitude generated by the HP8903A. (I set it at 0.5Vrms at 1kHz and by 90kHz it was down to 0.279Vrms) The last plot, I turned of the fluorescent lights and the computer monitor.
Attachments
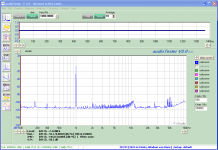
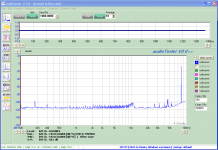
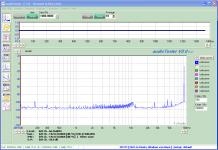
Hi Ken -- the level reading below the plot shows -8dB at 80kHz and -66dB at 90kHz, and yet the spectra and S/N ratios look essentially identical -- do you know why that is? Anyway good news on BW for Juli@. Thanks.
Hi Dick,
I noticed the same thing. I'm just guessing, but maybe 90kHz is just beyond the limits of either the card of the software. I didn't try 86kHz, being half the 192kHz might be the limit.
Ken
- Status
- This old topic is closed. If you want to reopen this topic, contact a moderator using the "Report Post" button.
- Home
- Design & Build
- Equipment & Tools
- Build -- Active Twin-T notch filter for distortion analysis