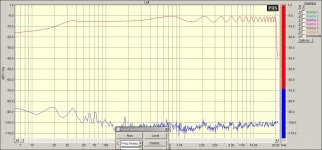
Hello all, I'm in the process of getting an old computer together for taking measurements from my workbench. My sound card is an old Sblive! model. Connecting the output to the input and doing a frequency sweep results in this plot.
Are the peaks caused by the input coupling caps? I used an external signal generator and verified the input against an oscilloscope to make sure the line out was not the cause. The caps are 0603 sized and my meter is unable to read their value in circuit. Has anyone found similar results?
Are the peaks caused by the input coupling caps? I used an external signal generator and verified the input against an oscilloscope to make sure the line out was not the cause. The caps are 0603 sized and my meter is unable to read their value in circuit. Has anyone found similar results?
Attachments
It seem a silly question, but are you sure you're not accidentally mixing the direct 'WAVE' signal with the 'LINE IN' signal within the sound card before feeding that to the output? If so, it would cause peaks and troughs in the response I would imagine. (I did something similar in my own amplifier distortion-measuring experiments recently, coming up with some mysteriously bad distortion results, and some very unpleasant sounds from the amp I was testing). The solution was to ensure that input and output were just 'LINE IN' and 'WAVE' respectively using the mixer applet.
Hello all, I'm in the process of getting an old computer together for taking measurements from my workbench. My sound card is an old Sblive! model. Connecting the output to the input and doing a frequency sweep results in this plot.
Are the peaks caused by the input coupling caps? I used an external signal generator and verified the input against an oscilloscope to make sure the line out was not the cause. The caps are 0603 sized and my meter is unable to read their value in circuit. Has anyone found similar results?
Hi, I am not familiar with instrumentation but I just downloaded a free
one called Visual Analyser and played with it.Even without any
connection or input.Of course the signal generator is selected for a 1khz.
and when I click ON The spectrum plot a wave which is actually
the noise floor of the soundcard which is soundblaster live like yours.
The plot averages around -120db similar to yours.So I think the bottom
plot is the noise floor of the other channel and the top trace is the other
channel of the result of the frequency sweep.or it could be the scope trace.
I think you should read the documentation of your software to counter check
if you done the right procedures and settings,if this is any help at all.
Ps noise is a random signal so it has peaks , it's normal.As to whether
you can lower the noise floor further I think you must be and expert in electronics to mod the board as I can only see decoupling caps even then
changing them may not be much help unless you can zero in what frequency
and calculate the correct size caps to filter it.Anyway at about -120db noise floor the soundblaster can make some decent measurements.
Regards
- Status
- This old topic is closed. If you want to reopen this topic, contact a moderator using the "Report Post" button.