Do You have any estimation for the duration of the beta tests? Will You keep us outside this beta circle informed of the progress?
I guess the tests are all about software. Is there any risk of hardware revisions?
It's hard to estimate how long the 2 beta testers are going to take.
But both are members of this forum so we can curse them if they're taking too long
Testing is only for software/firmware. No risk of hardware revision.
When and how will you be taking orders ?
The boards are going to be available pretty soon - this time I have a tracking number. Before shipping I'll need to check that it's all fine on the HW standpoint and we'll see what beta testers are reporting.
On the HW standpoint I'm not expecting any problem as the product has gone successfully through the whole development cycle: prototype and production sample.
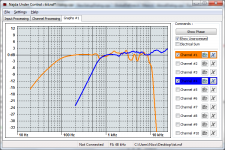
Here's another screenshot (still under Windows) showing the plotting section. I have loaded here the unprocessed responses of 2 drivers: a woofer on channel 1 and a tweeter on channel 4.

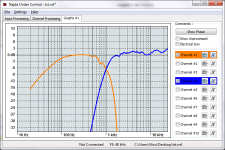
Well, let's say now that we want a FIR network crossing a 1kHz. The application will display the expected outcome for each channel separately.

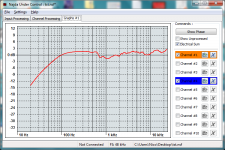
It can also display the electrical sum. I have here slightly boosted the woofer.

The above is not a proper strategy example for setting up a crossover - it's just a simple case that lets me testing the plotting utility. Note also that some details such as colors might change before the software release

Well, let's say now that we want a FIR network crossing a 1kHz. The application will display the expected outcome for each channel separately.

It can also display the electrical sum. I have here slightly boosted the woofer.

The above is not a proper strategy example for setting up a crossover - it's just a simple case that lets me testing the plotting utility. Note also that some details such as colors might change before the software release
Well, let's say now that we want a FIR network crossing a 1kHz. The application will display the expected outcome for each channel separately.
View attachment 323028
Why the asymmetric slope ? the number of tap ?
Is it possible to invert the phase of the channels?
Yes absolutely possible.
Why the asymmetric slope ? the number of tap ?
Again, the example above is not a proper setup in any way (the 1kHz crossing frequency is itself questionable).
These filters are 127-tap FIRs. They are voltage-complementary and perfectly symmetrical ... on a plot that uses linear scales.
Yes absolutely possible.
Again, the example above is not a proper setup in any way (the 1kHz crossing frequency is itself questionable).
These filters are 127-tap FIRs. They are voltage-complementary and perfectly symmetrical ... on a plot that uses linear scales.
It was perfectly clear to me that 1 KHz was not the appropriate cut off freq in this case and I know that depending on filter type, you should not take the first octave slope as a reference.
I probably miss something but according to the plot, we have an almost 24dB/octave slope for the high pass and a lot of more for the low pass...
Best regards from France
JC
They are voltage-complementary and perfectly symmetrical ... on a plot that uses linear scales.
[...] according to the plot, we have an almost 24dB/octave slope for the high pass and a lot of more for the low pass...
This is the explanation. But again, let's not argue about these filters specifically.
Hi Nick,
I noticed you are using .nsf files, what about other files like (ie. .pir ARTA files) ?
NSF stands for Najda Setup File. It's a file format devised for enumerating the processing options of the board. Basically, what you're going to find in this file is the signal routing, delays, gains, filters, channel inverts etc. Everything that you're setting up within the application can be saved in a NSF file and recalled at a later time.
ARTA lets you save your measurements in a csv file that has 2 or 3 columns: frequencies, magnitudes and optionally phases. This is the file format Najda is currently accepting when it comes to loading your measurements.
Is there any chance to apply settings both (all) channels live ?
Sorry I don't get that one
Last edited:
These filters are 127-tap FIRs. They are voltage-complementary and perfectly symmetrical ... on a plot that uses linear scales.
Here's an old trick -- a complementary pair of FIRs can be generated by one odd-length FIR (highpass or lowpass) and a delayed signal. That'll save almost half your computation, not a big deal for 1 kHz filters, but quite useful if you're crossing over in the low mids where FIRs can be several hundred taps long.
Last edited:
Happy to announce that I have received the boards, they're very nice.
Boards for beta-testers will ship end of this week or early next week.
Nice, count one with analog for me
Best
Jean Claude
Nice, count one with analog for me
Best
Jean Claude
one more here
...and another here.
That's cool!
Are there enough units in the first batch to supply all that has showed interest up till now ?
Should be alright
Originally Posted by dahlberg
Are there enough units in the first batch to supply all that has showed interest up till now ?
Should be alright
Excellent
I dont miss out. A preorder list would be appreciated
- Home
- Source & Line
- Digital Line Level
- DSP Xover project (part 2)
