BitPoint said:Hi,
Does anyone have the two-tone test signal (19 & 20 kHz, -3dBFS each tone) so that I can burn it into a CD. I want to use this signal to performance a intermodulation test for my PA.
Many thanks,
BitPoint
Hi BitPoint,
You will need -6dBFS each so it doesn't clip. If you can get a matlab script, here is the code to generate the test tone
clc;
TT = 60; %Total Time of Track in seconds
FS = 44.1e3; %Sample Rate
dB = 0; %Amplitude in dB
BITS = 16; %Number Of Bits Per Sample
F1 = 19e3; %Frequency 1
F2 = 20e3; %Frequency 2
AMP = 10^(dB/20) - .0001;
y =(AMP)*sin(2*pi*F1.*[0:1/FS:TT])/2 +(AMP)*sin(2*pi*F2.*[0:1/FS:TT])/2;
track = ['44p1k_19k_20k_16b.wav'];
wavwrite([y' y'],FS,BITS,track);
Dustin
You can do miracles with open source SoX http://sox.sourceforge.net/ .
Reads: create file intermodul wav with the same parameters as the non-existent input file (-n): fs 44100, 2 channels, 16 bits per sample, format wav. Apply the effect synth for 300 secs in mode create generating sine 20000Hz, chain another effect synth in mode mix generating sine 19000Hz. To prevent clipping, the mode mix halves the amplitude of input and generated signals automatically.
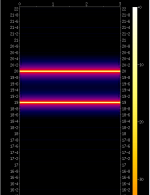
You can check spectrum of the resultant file by running
Cropped resultant picture spectrogram.png:
Code:
sox -V -r 44100 -c 2 -b 16 -t wav -n intermodul.wav synth 300 sine create 20000 synth sine mix 19000Reads: create file intermodul wav with the same parameters as the non-existent input file (-n): fs 44100, 2 channels, 16 bits per sample, format wav. Apply the effect synth for 300 secs in mode create generating sine 20000Hz, chain another effect synth in mode mix generating sine 19000Hz. To prevent clipping, the mode mix halves the amplitude of input and generated signals automatically.
You can check spectrum of the resultant file by running
Code:
sox intermodul.wav -n remix 1 spectrogram -y 4Cropped resultant picture spectrogram.png:
Attachments
- Status
- This old topic is closed. If you want to reopen this topic, contact a moderator using the "Report Post" button.