Ah yes, discoverer of the law of 'terminal complexity' as applied to circuit prototyping ............
.......when bits drop off at the same rate as one can solder them on, a prototype has reached 'terminal complexity'. It remains the fundamental limiting factor in circuit development that has held back progress ever since the introduction of the soldering iron and Band-Aid..................
")
LD
.......when bits drop off at the same rate as one can solder them on, a prototype has reached 'terminal complexity'. It remains the fundamental limiting factor in circuit development that has held back progress ever since the introduction of the soldering iron and Band-Aid..................
LD
I'm afraid you are interpreting things in line of your expectations by mentioning a notable difference in noise and in IMD sidebands.Under the circumstances that the test track is oddly quiet (see my post above), despite all there's definitely notable difference in both the noise floor and 400Hz IMD sidebands nearby 4kHz. And given the gross scale, I think it's fair to say the results are distinct despite a relatively small change in tracking angle (VTA in this case).
The frequency domain is not as good a way to look at this as the time domain, and chances are the sidebands indicate there might well be something FM worth looking for methinks. Both the noise floor and the sideband differences are probably a result of altered friction though, which is fair game and exactly what we might be looking for I think......
LD
However the images shown were for just one single FFT, taken from a 1sec time signal.
Because of many reasons like noise, scaloping losses etc, accuracy is at best +/- a few dB.
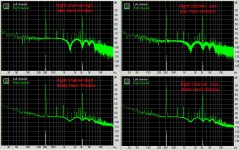
That's why I have made an extra set of FFT's, but now averaged over a timespan of 10 sec with the same filter bandwidth as the 1sec FFT's.
The result is in the images below.
Obvious is that over the period of 10 sec, no longer a difference in noise level exist between optimal VTA (Low) and VTA +1,5 degrees (High).
Also the IMD products are showing no obvious differences.
I am a bit amazed by the fact that +1,5 degrees added to the VTA is now called a relatively small change, where in postings before we were aiming at about a reproducible 0,1 degrees VTA change.
Plus 1,5 degrees can easyly been seen, showing an arm that is no longer being parallel to the platter.
The Dr Feickert procedure, [adjust the HTA to the point that phase angle of the crosstalk signal in both channels is the same, then adjust the VTA so that L+R phase angles of the crosstalk products are both at ca. 90 degrees] is far more accurate making a change of 1,5 degrees VTA very visible.
But many discussions and articles are mentioning that VTA is a very overestimated thing, so adjusting the cart parallel to the platter will probably be good enough in most if not in all cases.
Without prejudice I will wait for Scott's recording with an eliptical needle, just from an interested technological point of view.
Hans
Attachments
In fact there is notable difference in both frequency specific noise floor and sidebands for the 1s sample you first put forward Hans. Interpretation can only be suggestive, but neither such effects are easy to explain geometrically because at such a low level of recorded test signal one should expect near identical results. And 1s seems a reasonable sample period in the scheme of things...............I'm afraid you are interpreting things in line of your expectations by mentioning a notable difference in noise and in IMD sidebands.
In fact FFT IMD sidebands still show a pronounced difference...........contrary to geometric expectations. If the 10s sample has improved confidence, one must also say this difference is more probably real. I would say that difference is not expected, geometrically, and so one needs another explanation.That's why I have made an extra set of FFT's, but now averaged over a timespan of 10 sec with the same filter bandwidth...(..)......... no longer a difference in noise level exist between optimal VTA (Low) and VTA +1,5 degrees (High).....Also the IMD products are showing no obvious differences.
The noise floor now appears near identical, which I think is also unexpected given the 1s result, but not impossible.
Would you kindly explain how this is plausible, geometrically, Hans? As in what mechanical errors are supposed to be participating.....?The Dr Feickert procedure, [adjust the HTA to the point that phase angle of the crosstalk signal in both channels is the same, then adjust the VTA so that L+R phase angles of the crosstalk products are both at ca. 90 degrees] is far more accurate making a change of 1,5 degrees VTA very visible.
LD
We had a book in the lab that was just the right height to raise a test circuit to reach the analyser pods: it was called 'Some Real Support Devices'.......More possible proof - the two National Semiconductor Data Books supporting the scope!
LD
I'm afraid you're mistaken about that, Hans.Also the IMD products are showing no obvious differences.
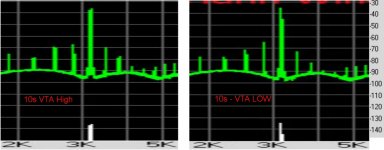
In fact there are definite quite pronounced differences in IMD products around the 3150Hz carrier (this test uses 300/3150Hz).
Attached is a magnified section from your 10s plot, showing the sidebands of interest. Vertical scale is 10dB per div, so these are significant differences. Side by side are the two traces for VTA differences of 1.5 deg.
So it's very likely that something IMD related was different between those two VTA settings in this test. As I say, the frequency domain isn't the best way to look at this, and I suspect that FM demodulating the sidebands of 3150Hz would be revealing, and potentially useful as a method of quantifying misalignment, along the lines of the patent Scott linked.
Main point is that this test, despite its 'non-optimal level', can apparently identify differences in alignment. A similar track should/might produce similar results for lateral misalignment, and there's method improvement opportunity to increase the recorded level, IMO.
My side point is that these differences shouldn't be there to the observed extent, if an entirely geometric explanation is satisfactory. So the issue is what else is going on........although pragmatically optimal alignment is optimal alignment, it's better to understand.
LD
Attachments
Last edited:
I won't argue about these differences of 3dB max, we seem to qualify that differently.I'm afraid you're mistaken about that, Hans.
In fact there are definite quite pronounced differences in IMD products around the 3150Hz carrier (this test uses 300/3150Hz).
LD
However, there is no measure to judge what is better, so it doesn't help in adjusting the VTA.
That's the beauty of the simple Dr Feickert Method, there is a simple measurable goal of 90 degrees phase angle for both crosstalk products.
The geometrical math behind this hasn't bothered me so far, I can only confirm that it works, see my posting #322 for that.
Whether this coincides with the best possible setting for the VTA wouldn't surprise me, but I don't know.
I will demodulate the sidebands of the 3150Hz signal. The model is already in place for 400Hz and 4Kz, so I have to modify filters to 315/3150 Hz.
Maybe this will shed some further light on the matter.
Hans
I won't argue about these differences of 3dB max, we seem to qualify that differently.
However, there is no measure to judge what is better, so it doesn't help in adjusting the VTA.
Yes, synthetic AM/FM signals also show very small differences visually in a magnitude only display the relative phases are essential in separating the FM and AM components.
I also think we're a little off track again, as far as I can tell the Adjust+ method squares up the cartridge/motor assembly as best as it can. I thought we were looking for something a little extra. A third degree of freedom?
BTW the folks that make the strain gauge cartridges claim that this method can fail because the crosstalk does not behave as expected.
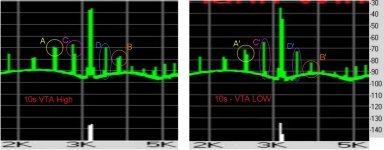
In fact the difference of the 2nd order sideband pairs, labelled A, A', B and B' in the attached mark-up, is 4.3dB and 8.2dB respectively. Which is surely significant.I won't argue about these differences of 3dB max, we seem to qualify that differently.
All sideband peaks appear to spread and span more than one FFT bucket. Or there's some weird FM doublet causing the same effect. So one has to properly account for total amplitude within the spread spectral peak, and once this is done the difference in peaks A and B with 1.5 deg change in VTA becomes obvious.
Interestingly, 1st order IM products at C and D have virtually no difference when properly analysed this way: 0.06dB and 0.6dB respectively, and this is probably also a valid and significant result.
As to interpretation, I think this is what one might expect to see in changes to 2nd harmonic distortion of 300Hz arising as discussed previously. But at an expectedly pronounced level, IMO, given the low modulation level of the test track.
That there can be detectable difference is a good start. Especially given the test track seems open to improvement as previously discussed. Proper interpretation is another discussion, but one might assume that minimal sidebands of a symmetrical nature is good.However, there, which is no measure to judge what is better, so it doesn't help in adjusting the VTA.
As Ray K says, FM probably holds the key to analysis and interpretation. FM demodulation of the 3150Hz carrier at a bandwidth of at least 600Hz so as to see the 2nd harmonic of 300Hz might provide some insight..........?
Then for all you know you might just be aligning for minimal friction, or aligning coils, or something else......... IMO it matters to understand how these tests are meant to work if we are ever to properly interpret them, or put them on a test record............The geometrical math behind this hasn't bothered me so far, I can only confirm that it works, see my posting #322 for that.
LD
Attachments
Last edited:
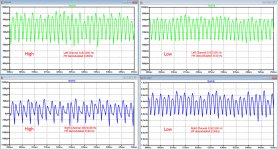
Here are the results when demodulating the 3150Hz signal.
Low is optimal VTA, High is VTA + 1.5 degrees.
In the low position FM modulation of the Left and Right channel are similar, apart from the fact that the demodulated signal from the left channel has to be inverted in polarity, exactly as in the patent.
The left channel shows little difference between optimal VTA (low) and VTA+1.5 degrees (High).
However the right channel in the High position suffers from some sort of FM distortion ??
Hans
Attachments
Hans, I am assuming all your measurements are done on your air bearing arm with Benz LP? Do you know if you have the early LP with Gyger stylus or the later micro ridge? not sure if it makes a difference but interesting to know which of the most severe profiles around you have
Thanks, Hans. Assuming the demodulation works OK, next step is to take the FFT of the demodulated signal so as to examine the frequency spectrum and amplitude of modulating components.Here are the results when demodulating the 3150Hz signal.
Stylus riding one groove wall (usually the inner) has a different length-time path on one channel than the other hence the FM? If so that could well be a stylus-groove friction artefact, but don't suppose you'd wish to hear that.............However the right channel in the High position suffers from some sort of FM distortion ??
LD
Last edited:
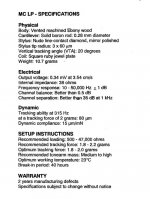
Bill, I don't know what stylus I have.Hans, I am assuming all your measurements are done on your air bearing arm with Benz LP? Do you know if you have the early LP with Gyger stylus or the later micro ridge? not sure if it makes a difference but interesting to know which of the most severe profiles around you have
Here is a copy of the document that came with the Cart.
Hans
Attachments
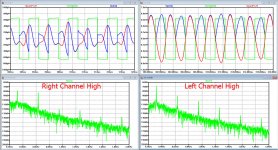
Another image, further analysing left and right channel with the raised VTA setting.
In the upper two images, red is the demodulated signal, green is a 315 square wave, extracted from the input signal.
This square wave switches the demodulated signal, thereby producing the blue signal, all exactly according to the patent.
The spectra below are from the red demodulated signal over a period of 1 sec.
Hans
Attachments
Last edited:
- Home
- Source & Line
- Analogue Source
- Test LP group buy