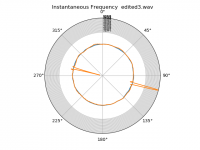
Thanks Pyramid and Scott. I edited out the blank section and boosted the gain in audacity. It is quite a bit louder now. The output looks different, but does not look right. I hope this is helpful for troubleshooting the script and what novice users like me might be doing that could be done better. Thanks for writing this, it is going to be very useful!
edited3.wav - Google Drive
For others: I installed Python 3.6.4, but then had to install scipy, numpy, and matplotlib using pip install from the command prompt. I didn't go for Anaconda or the other sci-packages.
edited3.wav - Google Drive
For others: I installed Python 3.6.4, but then had to install scipy, numpy, and matplotlib using pip install from the command prompt. I didn't go for Anaconda or the other sci-packages.
Attachments
I don't have audacity loaded, but I can hear some rather pronounced pops; are there gaps in the recording? If those are record ticks, maybe boosting the gain in audacity is causing the problem. It might work better to re-record the track at a higher level in the first place.
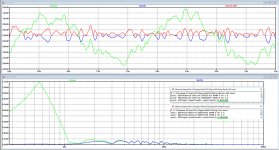
The spikes you see on the polar display are most likely caused by rapid (and large) changes in the frequency (between 3150Hz and 0 Hz for instance). The positive going glitch is what is causing the scale to be screwed up.
The spikes you see on the polar display are most likely caused by rapid (and large) changes in the frequency (between 3150Hz and 0 Hz for instance). The positive going glitch is what is causing the scale to be screwed up.
Although it is an extremely noisy .wav file, it is still useable.Hi Scott,
I got your script from post #562 (as well as the other changes you mentioned in the next few posts) and it is plotting something strange. Can you help? For starters, I had a lot of trouble to get the script to open the file in the first place (quotes and all). I'm on a Win7 machine. Here's the wav file:
edited.wav - Google Drive
Thanks!
There is quite some eccentricity, as can be seen in both images, but only the first harmonic at 0.55Hz.
No signs of Cart/Arm resonance in the spectrum ?
Speed stability is very good, Wow+Flutter IEC386 + Notch filtered is 0.029% !
Hans
Attachments
The spikes you see on the polar display are most likely caused by rapid (and large) changes in the frequency (between 3150Hz and 0 Hz for instance). The positive going glitch is what is causing the scale to be screwed up.
There is also a huge signal just below 20K that looks like aliasing. You can't just edit out spaces because the waveform is discontinuous in frequency. It is difficult to be robust against any possibility. 4sec or so of straight unbroken 3150Hz at 25% or more should not have problems unless the test LP is badly scratched or otherwise damaged.
Pyramid, no, there should be no gaps in the recording. Pops and ticks should be minimal also---I listened to it in Foobar. I'll record it again at a higher level this evening. I don't think the frequency is changing from 3150 to 0 Hz. But I can hear the eccentricity on the recording.
Hans, thanks! This is an SL1200 MK2 with a Dyna 10X5. I had done some spectrum analysis of the cart/arm resonance and I'll dig it up, but I haven't seen the 0.5 Hz resonance. The eccentricity can be easily heard on the recording and might be related to centering. I'm just wondering if I am doing something wrong in the process of recording. I'll try again tonight. Did you mean to attach two images? I can see only one.
Edit: Scott and I cross-posted. No, the record isn't damaged, it's pretty new actually. I'm just not sure I'm doing things correctly in Audacity. I trimmed the blank part, moved the part with a signal to the front of the file and then boosted it to the max gain available in Audacity (for the edited3.wav file). The first file does not have any edits (edited.wav).
Last edited:
I can confirm that there are no discontinuities nor strong pops or clicks in your recording.Hans, thanks! This is an SL1200 MK2 with a Dyna 10X5. I had done some spectrum analysis of the cart/arm resonance and I'll dig it up, but I haven't seen the 0.5 Hz resonance. The eccentricity can be easily heard on the recording and might be related to centering. I'm just wondering if I am doing something wrong in the process of recording. I'll try again tonight. Did you mean to attach two images? I can see only one.
However there is a strong 19Khz component, which may be caused by bad synchronisation between sound card and rescording software.
But since all that matters is the FM modulation of the 3150 Hz tone, these higher frequencies are filtered and do not disturb.
Amplifying your signal afterwards in Audacity, does not change anything to the content and can be left.
The 0.55 Hz is not a resonance but the eccentricity of the LP, after all 33 1/3 rpm is 0.55 Hz.
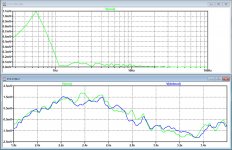
The image that I posted had two parts, in the upper part the frequency spectrum and in the lower part the pitch deviation for two consecutive full revolutions of the LP.
So mentioning the upper image was meant to be the upper part of the image, there is thus just one image.
Hans
Thanks Hans! I understand now about the 0.55 Hz eccentricity. That must be induced by the record, correct? Is there a reliable technique to properly center the record (other than trial and error)?
You mentioned speed stability was very good. Can you see that on the graph, or are you saying that based on the wow+flutter number? I'm relatively new to this and trying to learn.
You mentioned speed stability was very good. Can you see that on the graph, or are you saying that based on the wow+flutter number? I'm relatively new to this and trying to learn.
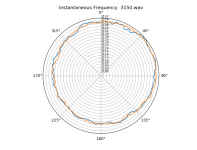
ra7, This came up before the transform method expects only one major tone but will lock onto any tone you have 1000Hz, 3000Hz, 3150Hz, 4000Hz whatever. I thought that might be a feature if you don't have 3150 on your LP. It's easy to switch to filtering first with a search through a list of possible candidates. I ran your file filtering before the transform rather than after. The next rev will do this automatically (I want to keep it no user edits needed for any input frequency). Other than a slight center offset it looks good. The 19kHz tone is as large as the 3150kHz tone so something is very wrong on the record end.
Attachments
Last edited:
Thanks Scott! That all makes sense. I redid the recording just now. Went straight to Audacity from the ADC. Earlier I was writing using JRiver, with all the EQ, channel processing, and convolution turned on (sorry guys). With the new recording, it worked right away! Wonderful! Thanks Hans, Pyramid, and Scott for all the help! I'm happy (and armed) with the knowledge that the SL1200 is doing its job.
Hans, which software/script are you using to do the spectral analysis and the wow+flutter?
Edit: I should mention that the image below is of a DIY pivot tonearm, not the same tonearm as the Technics in the analysis Hans and Scott did. This one does have some resonances that show up in the 5-10 Hz range.
Attachments
Last edited:
Wow+Flutter is calculated after roughly removing all frequencies below 2 Hz from the signal in the timegraph according to IEC386, thereby eliminating the effects of eccentricity of the test LP.Thanks Hans! I understand now about the 0.55 Hz eccentricity. That must be induced by the record, correct? Is there a reliable technique to properly center the record (other than trial and error)?
You mentioned speed stability was very good. Can you see that on the graph, or are you saying that based on the wow+flutter number? I'm relatively new to this and trying to learn.
See image below.
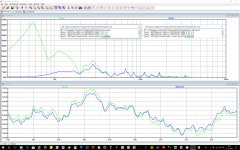
In the upper part, the timedisplay, green is Pitch variation, Blue is pitch variation after IEC386 fitering which would have the pitch variation for a non eccentric LP.
I have added an extra 0.55Hz notch filter because without you will still have remains of the eccentricity, corrupting the wow+flutter figure.
Red is what you get when taking the absolute value of the blue signal.
This red signal is what is used for the calculation of wow+flutter.
I have added both calculations in the image, one for IEC386 only and one whith extra 0,55 Hz notch filter.
Wow+flutter for both are resp. 0.041% and 0.029% showing that adding the extra notch filter makes sense.
In the Frequency graph in the lower part of the image, green is the spectrum of pitch variation versus time and blue is the spectrum of the filtered time signal, where eccentricy effects or low frequency components have been removed.
Hans
Attachments
Just to compare results, I have entered in my LtSpice model the MK3wFpu1.wav file that was provided by JP, see #527 and #528 on page 53 of this thread.
This file was a flawed experiment to record the motor's internal frequency generator. I'm surprised it measured only that badly.
Try this one: Dropbox - 20171221-T001.wav
........and there rests the case for the prosecution. It's one reason why such things aren't particularly useful or meaningful as a figure of merit.Wow+Flutter is calculated after roughly removing all frequencies below 2 Hz from the signal in the timegraph according to IEC386, thereby eliminating the effects of eccentricity of the test LP.
LD
Last edited:
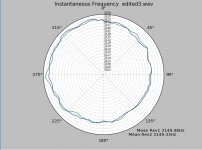
Here are the results, much better as before.This file was a flawed experiment to record the motor's internal frequency generator. I'm surprised it measured only that badly.
Try this one: Dropbox - 20171221-T001.wav
Wow+Flutter IEC386 0,039%
+0.55 Notch filter 0.029%
Average frequency 3147.2 Hz
For one reason or another, LD's opinion is that these IEC386 figures are not meaningful, but they simply give an idea how well the combination of TT, Cart and Arm are performing.
While Pitch deviation caused by LP eccentricity usualy is much more, in this very case ca +/- 0.15% peak it has to be regarded in relation to this.
Hans
Attachments


But they exactly don't tell that. Time averaging, filtering and weighting discards what's really important about audibility of pitch variation: time domain instantaneous shift.LD's opinion is that these IEC386 figures are not meaningful, but they simply give an idea how well the combination of TT, Cart and Arm are performing.
One can verify this easily by listening to the continuous 3150Hz tone recordings, or pretty much any test tone c 300 - 1kHz.
I suspect historic motivation may have been tied up with the 'spec wars' era, and to produce numbers deemed apparently inaudible? Whereas in reality many/most untreated rigs have plainly audible pitch variation for most people most of the time, given appropriate programme material.
LD
LD,But they exactly don't tell that. Time averaging, filtering and weighting discards what's really important about audibility of pitch variation: time domain instantaneous shift.
One can verify this easily by listening to the continuous 3150Hz tone recordings, or pretty much any test tone c 300 - 1kHz.
I suspect historic motivation may have been tied up with the 'spec wars' era, and to produce numbers deemed apparently inaudible? Whereas in reality many/most untreated rigs have plainly audible pitch variation for most people most of the time, given appropriate programme material.
LD
Thanks for further explaining your concerns.
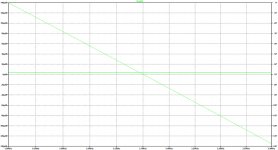
In my model, the recorded signal is processed by just one bandpass filter, which is absolutely linear phase, see image below.
In other words it is just acting as a timedelay of 1.27msec, which is the same as changing your listening position 15 inches backwards from the loudspeakers.
Both listening positions will give you the same auditory experience, nor can examining a time delayed signal lead to confusing results.
After this delay, amplitude information is removed and multiplied in an XOR to extraxt the FM modulation.
All this without any averaging, weighting or filtering at all.
The FM demodulated signal, being the average DC value from the XOR, has therefore to be regarded as a pretty accurate presentation of the pitch variation that could have been heard life IMHO.
That IEC 386 creates lots of phase deformation by weighting and filtering, doesn't change anything to the validity of the original FM demodulated signal
But it also means that if for what reason the IEC has chosen to use that specificic type of weighting to asess wow and flutter, its outcome is stable and reproducable when starting with the true undamaged FM modulation input.
Whatever its outcome is, we are all aware that it is not a figure of merrit for the TT alone, but is just giving some insight as a reference to others in the LF behaviour of the combo of TT, Arm + Cart.
One should also be aware of the reverberation effect of the listening room to what is heard, which can and will often cause seemingly audible pitch variations. So hearing pitch variation does not automatically mean that the cause of it is in the reproduced sound.
I would appreciate when you disagree to see your point of view elaborated a bit more in depth.
Hans
Attachments
As software can spit out both trivially I am not sure what the issue is. If you are tuning your system you want the full raw data to work from. If you want a number to compare to other numbers then run through the IEC as postprocessing. That way all are happy? Am I missing something?
Bill,As software can spit out both trivially I am not sure what the issue is. If you are tuning your system you want the full raw data to work from. If you want a number to compare to other numbers then run through the IEC as postprocessing. That way all are happy? Am I missing something?
As far as I'm concerned, that is the nail on the head.
Let everybody be happy with whatever he wants for whatever reason and give as much detail as possible.
Hans
- Status
- This old topic is closed. If you want to reopen this topic, contact a moderator using the "Report Post" button.
- Home
- Source & Line
- Analogue Source
- Turntable speed stabilty