
6k8 >-3.17dB
5k6 > -5.29dB
4k3 > -7.50dB
3k3 > -9.72dB
2k4 > -12.31dB
1k8 > -14.89dB
1k5 > -16.7dB
1k1 > -19.1dB
820 > -21.6dB
620 > -24.1dB
500 > -26.0dB
360 > -28.8db
300 > -30.5dB
220 > -33.1dB
160 > -35.8dB
133 > -37.4dB
100 > -40.1dB
56 > -45.1dB
34 > -49.4dB
18> -54.9dB
10> -60dB
BTW, some years ago I posted an ms excel spreadsheet that does that for you and it included an Rload option in the calculation.
Last edited:
Top one is min vol, 10kohms series and 0ohms to ground
Bottom one is max vol, 0ohms series and 10kohms to ground
That's all there is.
Here is a link
Kikitronic -- DIY Audio Kits: Attenuator for volume control
Cheers George
Bottom one is max vol, 0ohms series and 10kohms to ground
That's all there is.
Here is a link
Kikitronic -- DIY Audio Kits: Attenuator for volume control
Cheers George
He/she forgot about the effect of Rs and Rload.Top one is min vol, 10kohms series and 0ohms to ground
Bottom one is max vol, 0ohms series and 10kohms to ground
That's all there is.
Here is a link
Kikitronic -- DIY Audio Kits: Attenuator for volume control
Cheers George
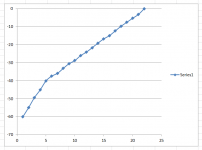
Below is what I get when I plot it in Excel (minus the first position, which would be -infinity). It doesn't look bad but you have ~26dB attenuation at 50% rotation, vs. ~20dB for a typical 10A taper pot. I assume that's what you want?
Cheers,
Cabirio
Cheers,
Cabirio
Attachments
My RS will be 250ohm and RL will be 100kohmsHe/she forgot about the effect of Rs and Rload.
Cheers George
The difference vs. Rs=0 and Rl=infinity is in the hundredths of a dB.My RS will be 250ohm and RL will be 100kohms
Cheers George
Cheers,
Cabirio
Edit: sorry, strike that: max. difference ~0.2dB at 100% rotation.
Last edited:
Sure, the plot I posted is in dBs so a perfect log curve would be a perfectly straight line, which isn't far from what you get, in fact it's probably much closer than the standard log pot made with two linear segments.That's what I thought, virtually no effect.
So as it stands do you think that the resistors used from min to max are somewhere in the region of a log curve?
Cheers George
Cheers,
Cabirio
With Rload >> 5times the vol pot value you get a good approximation by assuming Rload = infinity.That's what I thought, virtually no effect.
If instead one chose to ignore the normal advice and fit a 10k load on a 10k vol pot then you will see a very different story.
A log law control means a constant attenuation increment for each adjustment change, i.e. YdB per degree of rotation.So as it stands do you think that the resistors used from min to max are somewhere in the region of a log curve?
Sorry just saw your attachment it look more lin than log to me
Cheers George
This would show on the plot as a straight line as mentioned by Cabirio.
The non constant slope shows on the plot around the -35dB to -45dB.
The attenuation values show a range of 1.6dB to 5.0dB per step. The plot makes it look quite good. The values in post3 show that it is good over much of the range, but pretty poor in that narrow range.
Last edited:
- Status
- This old topic is closed. If you want to reopen this topic, contact a moderator using the "Report Post" button.
- Home
- Source & Line
- Analog Line Level
- 10kohm series/shunt 23 position resistor attenuator.