Hi! I am a new member.
Recently tring to build a 2nd order active crossover circuit using fieild standard structure,ie,2 identical resistor and 2 identical capacitor and 2 opamp( one input unity buffer , one for filter).
As completed the assembly,I tested the circuit function with sinwave generator and digital oscillscope than found:
1.output voltage changes about 0.5v as frequency changes about 1.5k hz for low pass structure,but
2.output voltage changes about 0.5v as frequency changes about 5k hz for high pass structure.
theoretically, increasing and decreasing slop shall be indentical for high and low pass,is it? Why I got different slop?
Will appreciate any one can reply the answer.
theoretically, increasing and decreasing slop shall be indentical for high and low pass,is it? Why I got different slop?
Are you sure that the slope really is different? Maybe the cutoff frequency is different instead. The parts values could be wrong.
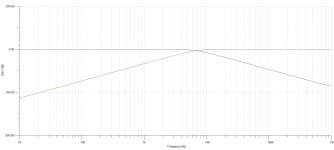
Not identical slop
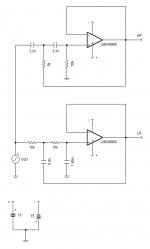
Circuit as attached file, slop is indeed different.
To:Rayma , thanks for replyAre you sure that the slope really is different? Maybe the cutoff frequency is different instead. The parts values could be wrong.
Circuit as attached file, slop is indeed different.
Attachments
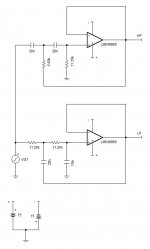
First of all, for your Fc calculation you have an extra term that does not apply here; drop the X 1.414 factor, that only applies to a LR4 alignment not a B2 as you show. With the values used you get a B2 @ 6.8kHz.
If you are getting anything else you must have a bad component or a wiring/connection error.


Mike
If you are getting anything else you must have a bad component or a wiring/connection error.


Mike
The Butterworth roll-off curve can be approximated to a theoretical two line "curve".
The horizontal line in the passband and the slope line in the stopband.
The 2pole filter has a slope of 12dB/octave, which is equal to 40dB per decade.
The intersection of these two lines is calculated using the F-3dB formula. The actual response at the F-3dB frequency is 3dB down from the theoretical intersection point.
Either side of that "point" the actual response lines get closer to the theoretical lines, but they take a lot of octaves before they get close enough to be immeasurably equal to the theoretical.
You should take account of this difference between the 2slope and the curve of the Butterworth response.
You can see the actual curve in Michael's example. The F-3dB is @ ~6.8kHz.
You can see the curve has not reached the straight line part at 3.4kHz and at 13kHz. But it is getting very close.
You can measure out at one decade (~3 octaves) from 6.8kHz and measure the difference @ 680Hz and @ 68kHz and your difference will still exceed 1% (~0.1dB).
Last edited:
After closely review Andrew's and Micheal's messages,I probably know the cause of my question.
According to the frequency response graph(Take Micheal's graph as example),the X-Axis scale is not identical with increasing frequency.For high pass filter,output increasing from -35db to -3db(Around 7k hz point) as frequency increased from 1khz to 7 khz,ie,output is 32db increased with 6khz increment.
For low pass filter,also 32db output decreased with 33khz increment(From 7khz to 40khz).
So that the both slope is identical.
Question:If Imake the graph with same scale freqnency increment(every 100hz or 200hz......),the up/down slope is still not indentical,my question is still there.
the slope is usually given as 6dB/octave of multiples thereof, or as 20dB/decade or multiples thereof.After closely review Andrew's and Micheal's messages,I probably know the cause of my question.
According to the frequency response graph(Take Micheal's graph as example),the X-Axis scale is not identical with increasing frequency.For high pass filter,output increasing from -35db to -3db(Around 7k hz point) as frequency increased from 1khz to 7 khz,ie,output is 32db increased with 6khz increment.
For low pass filter,also 32db output decreased with 33khz increment(From 7khz to 40khz).
So that the both slope is identical.
Question:If Imake the graph with same scale freqnency increment(every 100hz or 200hz......),the up/down slope is still not indentical,my question is still there.
If the filter is single pole then you will see a slope of 6dB/octave.
One octave is a doubling or halving of the frequency.
i.e a change of 6dB when the frequency changes by half.
A Butterworth 2pole (sometimes written as B2) would be a change of 12dB for a doubling or halving of frequency.
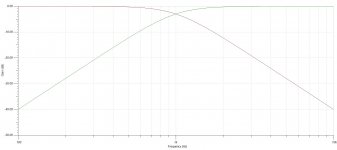
You can see this in Michael's latest plot.
-40dB@ 100Hz, 12dB higher @ 200Hz (-28dB), 24dB higher at 400Hz (-16dB) here you can see the difference from the theoretical straight line and the actual, 36dB higher @ 800Hz (-4dB) now the difference really shows up. 40dB higher @1kHz (-0dB) now the difference is 3dB. i.e. difference between the Theoretical and the actual at the roll-off frequency has become 3dB.
Last edited:
Mike,still not understand quite well.Maybe this will help. A second order filter roll off slope is 12dB per octave or 40dB per decade. Decibels use a logarithmic scale. To illustrate this in a way that is easier to see, I've recalculated the HP and LP filters for a 1kHz Fc.
View attachment 484570
View attachment 484571
Mike
Refer to your graph(Ft 1khz),high pass slope frequency changes from 100hz to 1k hz and resulting 40db changes.The low pass slope frequency,howerever,changed from 1k hz to 10 khz and resulting same 40 db changes,both slopes is identical because of same decade.
Question1:For hp 1khz change can results 40db changes,but for lp needs
10k hz. so actually the slope is indeed not identical if graph is made
with same scale for X-axis,ie,100 hz to 1k hz for hp and 1k hz to 1.9 K HZ for lp, is it correct?
Question2:The Fc equation can result many combination of R and C,what will be different by using different R and C?
Thank you very much/jsc
Decibels use a logarithmic scale.
Changing R or C can alter Fc and/or filter "Q", I suggest you take a look a the ESP site articles (Here: http://sound.westhost.com/articles.htm) , scroll down to "Beginners' Luck - The beginners' Guide to ..." and "Design Guidelines" and read about filters.
Mike
Changing R or C can alter Fc and/or filter "Q", I suggest you take a look a the ESP site articles (Here: http://sound.westhost.com/articles.htm) , scroll down to "Beginners' Luck - The beginners' Guide to ..." and "Design Guidelines" and read about filters.
Mike
Last edited:
1kHz to 100Hz is one DECADE of frequency change................frequency changes from 100hz to 1k hz and resulting 40db changes.
is also one DECADE of frequency change................ 1k hz to 10 khz
Yes both are 40dB/decade, both are identical SLOPEand resulting same 40 db changes,both slopes is identical because of same decade.
The SLOPE is stated as xdB/octave or ydB/decadeQuestion1:For hp 1khz change can results 40db changes,but for lp needs
10k hz. so actually the slope is indeed not identical if graph is made
with same scale for X-axis,ie,100 hz to 1k hz for hp and 1k hz to 1.9 K HZ for lp, is it correct?
The R & C of a filter define the Time Constant of the filter.Question2:The Fc equation can result many combination of R and C,what will be different by using different R and C?............
If the multiplicand of R*C is the same, then the filter is the same.
You can use 10R & C/10, or 5.5R & C/5.5, or any other same value time constant.
The formula for a filter is:
F-3dB=1/{2 Pi RC} where RC is the time constant.
Last edited:
To: Andrew1kHz to 100Hz is one DECADE of frequency changeis also one DECADE of frequency change.Yes both are 40dB/decade, both are identical SLOPE The SLOPE is stated as xdB/octave or ydB/decadeThe R & C of a filter define the Time Constant of the filter.
If the multiplicand of R*C is the same, then the filter is the same.
You can use 10R & C/10, or 5.5R & C/5.5, or any other same value time constant.
The formula for a filter is:
F-3dB=1/{2 Pi RC} where RC is the time constant.
I already understand the response graph is based on db/decade,thank you very much for your patient expanation.I am still wondering what will happen if graph is based on proportional scale,ie,volts for Y-axis and HZ for X-axis.
Side question:About 3rd order bessel active low/high pass filter(using one opamp) ,do you know the practical equation for cut off frequency and how to calculate the value of element R,C ?
Regards/JSC
- Status
- This old topic is closed. If you want to reopen this topic, contact a moderator using the "Report Post" button.
- Home
- Source & Line
- Analog Line Level
- Not Equal Slope of Active Crossover at Same Cut Of Frequency

