I'm working on some turntable drive systems. I need to measure how they perform: does anyone know of some public domain software that can extract a wow/flutter figure from say a recorded wave file, or even give real time wow/flutter figures from a test tone injected into a PC sound card?
On this page http://www.diyaudio.com/forums/showthread.php?s=&threadid=33479&perpage=25&pagenumber=2 you can read a method for measuring wow and flutter.
It won't give you values to compare with measurements made in another way, but it will give you values which you can compare with earlier measurements to see if you're improving on things.
"Official" wow and flutter measurements depend heavily on standards and protocols which will prove very difficult to engineer yourself.
greetings, MArco
Hi Steerpike,
I am also very interested in doing this but in the past didn’t found anything ready made for it for free. Here is some software that does it. It comes complete with a test record but it is huge expensive:
http://www.adjustplus.de/
(If you can read German)
To do it you need a test record with a pure sine tone (usually 3 kHz) and a FM-demodulator for extracting the deviation from the test tone.
In the past I did it with Spectrum Lab for the FM-demodulation and fed the output to a FFT analysing program. Spectrum Lab is free and can be found here:
http://freenet-homepage.de/dl4yhf/spectra1.html
Cheers")
I am also very interested in doing this but in the past didn’t found anything ready made for it for free. Here is some software that does it. It comes complete with a test record but it is huge expensive:
http://www.adjustplus.de/
(If you can read German)
To do it you need a test record with a pure sine tone (usually 3 kHz) and a FM-demodulator for extracting the deviation from the test tone.
In the past I did it with Spectrum Lab for the FM-demodulation and fed the output to a FFT analysing program. Spectrum Lab is free and can be found here:
http://freenet-homepage.de/dl4yhf/spectra1.html
Cheers
Hi Pjotr
It's seems odd that no-one had done it, since a desktop computer is so ideally suited to it!
I do have a test disc, but for those who DON'T have, it would be also possible to print a disc - like a strobe disc - and pick off the frequency optically with a photodiode (or a pair of photodiodes for more accuracy)
That Spectrum lab might be just what I need - thanls for the link.
Otherwise, maybe a simple analogue PLL circuit to detect the FM component, and then do the A/D conversion.
Here a result I got with Spectrum Lab with a 1 kHz test tone from a Cardas test record. TT was a Transrotor Fat Bob with a SME series-V arm. Cart was a Benz ACE. The TR is one of the most sturdy TT’s with regard to speed stability. What you see is the difference of the FB equipped with (green) and without (orange) their advertised TDM bearing.
Clearly visible is the 50 Hz torque ripple from the synchronous AC motor. Also you can see the 0.55 Hz spike from the not perfect centricity of the test record.
The cause of the other spikes below 50 Hz I don’t know…..
Cheers
Clearly visible is the 50 Hz torque ripple from the synchronous AC motor. Also you can see the 0.55 Hz spike from the not perfect centricity of the test record.
The cause of the other spikes below 50 Hz I don’t know…..
Cheers
Attachments
Ok good luck Steerpike
To give the levels an absolute meaning you can make a reference signal: Say a 3 kHz test tone FM-modulated with 0.1% deviation. This will give you then a reference level. You can make this with the build-in signal generator of Spectrum Lab itself.
My previous post was just to show how deep you can measure with a soundcard, a test record and some free software.
And yes, it is big fun!
Here a result I got with Spectrum Lab with a 1 kHz test tone from a Cardas test record. TT was a Transrotor Fat Bob with a SME series-V arm. Cart was a Benz ACE. The TR is one of the most sturdy TT’s with regard to speed stability. What you see is the difference of the FB equipped with (green) and without (orange) their advertised TDM bearing. Clearly visible is the 50 Hz torque ripple from the synchronous AC motor. Also you can see the 0.55 Hz spike from the not perfect centricity of the test record.
Very nice work. Can you please explain how you obtained this graph with the mentioned software?
Thanks, MArco
Hi Marco,
Oh boy, that is not said in a few words. I did it more than a year ago. If I have time I will post a screen shot of the set-up window next weekend. Basically it is 1 KHz signal in from test record --> FM-demodulator --> FFT spectrum.
FYI: In the above picture, a reference signal with 0.1 % deviation is at –90 dB. For regular W&F figures you have to integrate the spectrum and apply the appropriate weighting according to the standards. But the plain spectrum says more about what is really happening.
Peter and all,
inspired by your postings of yesterday I gave Spectrum Lab a try and at once gave up on it. But it inspired me to have a (disciplined) go at it with Cooledit/Audition ...
It's what I got from a badly-setup standard Gyro MkV with VC supply.
Don't remember the test record used, as it is from an old file.
The 55Hz peak appears in most/all of my speed measurement attempts (over all TTs, and all drive systems), so is probably on that record. I need some time to sort this out and then pick the best LP for these things.
The wide bump at 10Hz is the cartridge/arm resonance. It would be wise to use a Shure M97 or V15 with damper, just for speed measurements...
But oh well, here's the procedure in short:
1) make recording of 1kHz lateral test track at 44.1kHz
2) read into A(udition) as 32 bit
3) convert from L(eft)R(ight) to M(id)S(ide) format (so L track contains M, R track contains S)
4) delete S
5) remove ticks and pops from M
6) filter M *twice* with a Chebichev2 band filter at 700 and 1300Hz, 11th order
7) adjust gain of M track to that its average RMS is -16dB exactly
8) find the average frequency of M using a 65536pt FFT
9) generate a sine of exactly that frequency in the S track (or R)
10) adjust the gain of the S track to exactly -16dB average RMS
That was the preparation ;-)
11) select S (R) and copy onto clipboard
12) select M (L) and mix_paste clipboard onto it with the Modulate option
13) downsample the whole file to 1.2kHz, 32 bit, mono (retaining only the L channel), maximal filter quality
14) do a 4096pt FFT over the central 20 seconds of the result, that's the W&F spectrum
inspired by your postings of yesterday I gave Spectrum Lab a try and at once gave up on it. But it inspired me to have a (disciplined) go at it with Cooledit/Audition ...
An externally hosted image should be here but it was not working when we last tested it.
It's what I got from a badly-setup standard Gyro MkV with VC supply.
Don't remember the test record used, as it is from an old file.
The 55Hz peak appears in most/all of my speed measurement attempts (over all TTs, and all drive systems), so is probably on that record. I need some time to sort this out and then pick the best LP for these things.
The wide bump at 10Hz is the cartridge/arm resonance. It would be wise to use a Shure M97 or V15 with damper, just for speed measurements...
But oh well, here's the procedure in short:
1) make recording of 1kHz lateral test track at 44.1kHz
2) read into A(udition) as 32 bit
3) convert from L(eft)R(ight) to M(id)S(ide) format (so L track contains M, R track contains S)
4) delete S
5) remove ticks and pops from M
6) filter M *twice* with a Chebichev2 band filter at 700 and 1300Hz, 11th order
7) adjust gain of M track to that its average RMS is -16dB exactly
8) find the average frequency of M using a 65536pt FFT
9) generate a sine of exactly that frequency in the S track (or R)
10) adjust the gain of the S track to exactly -16dB average RMS
That was the preparation ;-)
11) select S (R) and copy onto clipboard
12) select M (L) and mix_paste clipboard onto it with the Modulate option
13) downsample the whole file to 1.2kHz, 32 bit, mono (retaining only the L channel), maximal filter quality
14) do a 4096pt FFT over the central 20 seconds of the result, that's the W&F spectrum
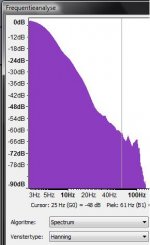
All inspired I followed this procedure (using Audacity):
Record a 2000Hz tone (had that one at hand) (one channel only).
Low pass filter 24 db at 5000 Hz.
Using FFT determined average frequency: 2041 Hz.
Using the nyquist plugin I wrote earlier (documented in: http://www.diyaudio.com/forums/showthread.php?s=&threadid=33479&perpage=25&pagenumber=2 )
Then a FFT transform on the result gave me the attached result.
MArco
Attachments
Werner said:Peter and all,
inspired by your postings of yesterday I gave Spectrum Lab a try and at once gave up on it.
Hi Werner,
You gave up on it? I do not expect that from you …………..
S.L. is in fact a signal processing toolbox and Wolfgang Buescher (and many others) did a very good programming job. And as with other power tools it takes some time to manage it. But it is well suited for the job requested for free. You can even implement the weighting filter in it ( I myself didn’t do that yet) and with some handwork you can get from the spectrogram the standardised weighted peak-value figures.
Instead of sending the output of FM demodulator to the FFT processor you can send it to the build-in oscilloscope and read the peak values directly from that.
You can of coarse use the slope of a filter to detect frequency shift but you get also a lot of amplitude noise of the original signal you don’t want.
Cheers
"You gave up on it? I do not expect that from you …"
I was in a hurry, and anyway it made me see the light with
Audition. Further I am interested in the w&f spectrum, not so
much a single figure, so SL doesn't buy me anything I need.
But I agree that it seems an exceedingly nice toolbox and
I may use it in the future.
I was in a hurry, and anyway it made me see the light with
Audition. Further I am interested in the w&f spectrum, not so
much a single figure, so SL doesn't buy me anything I need.
But I agree that it seems an exceedingly nice toolbox and
I may use it in the future.
- Status
- This old topic is closed. If you want to reopen this topic, contact a moderator using the "Report Post" button.
- Home
- Source & Line
- Analog Line Level
- how to? simple wow/flutter measurement