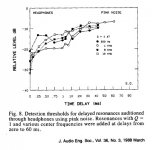
The info pictured here seems to agree with Dr Gedde's statement above, for sustained (pink) noise, but disagree for impulses, but I may be reading it incorrectly, or trying to compare apples to hedgehogs.
All as I would expect except for the lone 200 Hz impulse. That doesn't make sense to me. But then I am not sure what a 200 Hz impulse at 10 Hz means. maybe there is something in the signal that is being detected.
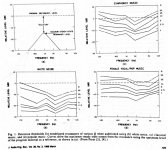
Here are audibility thresholds for non delayed resonances from Olive and from a different study by Fryer.
These are useful to illustrate impact of Q and source signal on resonance audibility.
Both confirm its easier to detect low Q resonances than high Q resonances, especially in the frequency range of loudspeaker panel resonances. At higher frequencies (eg where hard cone break up occurs), higher Q resonances become easier to detect, but low Q resonances are still easier to detect.
These studies showed (and confirmed by yet another study by Bech) that its easiest to hear low delay resonances using noise.
A yet again different by Olive on the audibility of reflection showed reflections with greater than 10ms delay are most easily detected using impulses, below that by noise. This further infers that resonances in loudspeaker cabinets are probably easiest to detect when using a noise signal.
Attachments
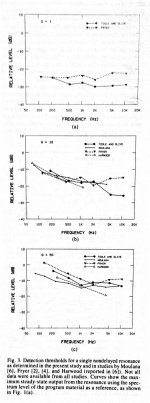
If I am reading those curves right then as the Q goes up the total energy of the aberration goes down, since the peak level is what is held constant not the area under the curve. That's kind of wrong for resonances since as a resonance is damped the peak level drops as well as the area under the curve. That would make those curves inapplicable as far as Q goes. Noise being more evident than impulses is probably correct however.
Oops: I should have attached figures 8 and 9, not 9 and 10.
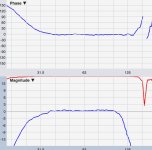
This curve implies that cabinet diffraction would be highly audible since its time delays are fractions of a ms.
I tried it, expecting to hear a subtle difference.
Thanks Craig
You may try the files I’ve uploaded (there will be there for a few days).
Two identical files are mixed to mono –6db.
No attenuation, no filtering. Only progressive increase of delay between the two files.
The result is a change in tonality of the classic guitar (*).
This is only to test your detectability threshold of delay with this particular music piece .
")
1 No delay
Dropbox - 1 mix no delay.wav
2 0.1ms delay
Dropbox - 2 mix 0.1ms delay.wav
3 0.2ms delay
Dropbox - 3 mix 0.2ms delay.wav
4 0.4ms delay
Dropbox - 4 mix 0.4ms delay.wav
5 0.6ms delay
Dropbox - 5 mix 0.6ms delay.wav
6 0.8ms delay
https://www.dropbox.com/s/c3zrr3e1d1k3qma/6 mix 0.8ms delay.wav?dl=0
7 1.0ms delay
https://www.dropbox.com/s/7ov0ujuxrom5xrk/7 mix 1.0ms delay.wav?dl=0
8 1.2ms delay
https://www.dropbox.com/s/o9l5hf4uxekkzec/8 mix 1.2ms delay.wav?dl=0
9 1.4ms delay
https://www.dropbox.com/s/jaxxy2uyk7ijn93/9 mix 1.4ms delay.wav?dl=0
10 1.6ms delay
https://www.dropbox.com/s/o835iogth68y5vy/10 mix 1.6ms delay.wav?dl=0
11 1.8ms delay
https://www.dropbox.com/s/9ayyg3btk2qzi6r/11 mix 1.8ms delay.wav?dl=0
12 2.0ms delay
https://www.dropbox.com/s/30793ubbzyqx785/12 mix 2.0ms delay.wav?dl=0
13 2.2ms delay
https://www.dropbox.com/s/y4lf9cfmi1i7cyy/13 mix 2.2ms delay.wav?dl=0
14 2.4ms delay
https://www.dropbox.com/s/z6searcyocbgxhp/14 mix 2.4ms delay.wav?dl=0
15 2.6ms delay
https://www.dropbox.com/s/wxth6cpupk8855t/15 mix 2.6ms delay.wav?dl=0
16 2.8ms delay
https://www.dropbox.com/s/38wlip8bln9oka0/16 mix 2.8ms delay.wav?dl=0
17 3.0ms delay
https://www.dropbox.com/s/katruh9a9orv8ue/17 mix 3.0ms delay.wav?dl=0
George
(*) LP Rip Extract. Side 1 track 5 from Lyra SYLP 3552,
If I am reading those curves right then as the Q goes up the total energy of the aberration goes down, since the peak level is what is held constant not the area under the curve. That's kind of wrong for resonances since as a resonance is damped the peak level drops as well as the area under the curve. That would make those curves inapplicable as far as Q goes. Noise being more evident than impulses is probably correct however.
Sean also wrote somewhere (can't remember where) that it appeared as if audibility was closely related to total energy.
I like how he expresses it here based on peak level as that is how we would observe it in a measurement.
Kind of a double post - I've linked this in another thread I started.
I'm adding it here too, cos it may be of use to someone who finds this thread a year or three from now.
Post 52 here shows a good alternate (or addition) to the tests I tried.

His earlier comment (post 48) is interesting:
"You should see the clicks reflecting off different things inside the box on the scope [...]
The biggest one for mine was the woofer magnet"
It ties in nicely with what has come earlier in this thread here, e.g. post 158
brig001's comment implies that the size / shape of the magnet and frame would be also important, e.g. I'd expect something like a Scan Speak Illuminator to do well on his test rig.
Over-engineering the cabinets is now lower on my priority list - I'll still do it, to some extent, but I won't throw stupid money at it.
I'm adding it here too, cos it may be of use to someone who finds this thread a year or three from now.
Post 52 here shows a good alternate (or addition) to the tests I tried.
His earlier comment (post 48) is interesting:
"You should see the clicks reflecting off different things inside the box on the scope [...]
The biggest one for mine was the woofer magnet"
It ties in nicely with what has come earlier in this thread here, e.g. post 158
"You have shown the sound radiation through the cone is much more significant, that's a good point. But I think that it remains to be seen if this is significant given the direct sound radiation. [...] a much heavier cone, like the pro units that I use, would be much better in this context."
brig001's comment implies that the size / shape of the magnet and frame would be also important, e.g. I'd expect something like a Scan Speak Illuminator to do well on his test rig.
Over-engineering the cabinets is now lower on my priority list - I'll still do it, to some extent, but I won't throw stupid money at it.
Like with the erroneous impressions about spatial localization of low freq tones. When you test with pure tones in a lab setting, there's localization at 90 Hz. But when music is playing, you can crossover subs at 120 Hz without any sense of localization (and moving more of the bass into your subs is really a very big benefit in configuring your system).Here are audibility thresholds...
How were these tests conducted? Just because the person being tested can tell Sound A from Sound B when instantaneously compared doesn't mean they can sense at any comparable level on an absolute basis in real-world settings.
B.
The basic principle of stereophonic music reproduction is based on using the abilities and flaws of our hearing-perception system. We hairless apes are rather deteriorated in that territory, fortunately! But individual differeces occur. And then some of the scientists are trying to put all that in numbers and equations...
I keep wondering how our dogs hear stereo-music???YouTube

I keep wondering how our dogs hear stereo-music???YouTube
Hollowboy, just returned to this thread after several months. I know its a little late, but for "extreme" or "overkill" stuffing tests, how about 4" thickness of semi-rigid fiberglass, such as Owens Corning 703, Johns Manville, etc. or similar, at 3 to 4 lb./cu. ft. density. Its one of the most effective acoustic absorbers, inexpensive, and widely found at industrial insulators or the internet.
Owens Corning 703, 4" thickness, Wall Mounted:
Freq........Acoustic Absorption Coefficient
1000Hz...1.08
500 Hz....1.24
250Hz.....1.24
125 Hz....0.84
https://www.bobgolds.com/AbsorptionCoefficients.htm
Owens Corning 703, 4" thickness, Wall Mounted:
Freq........Acoustic Absorption Coefficient
1000Hz...1.08
500 Hz....1.24
250Hz.....1.24
125 Hz....0.84
https://www.bobgolds.com/AbsorptionCoefficients.htm
Last edited:
Over-engineering the cabinets is now lower on my priority list - I'll still do it, to some extent, but I won't throw stupid money at it.
Yes, precisely my opinion as well. It amazes me how many people believe that cabinets are such an important factor when all the data says otherwise - and has for decades.
Hollowboy, just returned to this thread after several months. I know its a little late, but for "extreme" or "overkill" stuffing tests, how about 4" thickness of semi-rigid fiberglass, such as Owens Corning 703, Johns Manville, etc. or similar, at 3 to 4 lb./cu. ft. density. Its one of the most effective acoustic absorbers, inexpensive, and widely found at industrial insulators or the internet.
Owens Corning 703, 4" thickness, Wall Mounted:
Freq........Acoustic Absorption Coefficient
1000Hz...1.08
500 Hz....1.24
250Hz.....1.24
125 Hz....0.84
https://www.bobgolds.com/AbsorptionCoefficients.htm
Those coefficients are for normal angles of incidence. I thought this stuff didn't absorb so well compared to loose stuffing when angles were oblique?
Yes, precisely my opinion as well. It amazes me how many people believe that cabinets are such an important factor when all the data says otherwise - and has for decades.
Please share this data! Sounds intriguing.
Those coefficients are for normal angles of incidence. I thought this stuff didn't absorb so well compared to loose stuffing when angles were oblique?
I think that you have that backwards. One can usually only get absorption numbers > 1.0 from the random incidence tables, not normal incidence. There are angles off normal that can have greater absorption than normal incidence.
Please share this data! Sounds intriguing.
I have shared the results of several experiments on this topic that I did and some students of mine have done. I also talked with a guy who did an FEA study (he found that only the back panel (which in his sim was just a thin"ish" panel screwed on) was at all significant They are posted in this thread somewhere.
Basically the bottom line is that we were unable to measure the cabinet radiation in the far field because it was swamped by the drivers radiation. These were all "normal" cabinets not flimsy ones. I am sure one could create a cabinet where the sound from it was audible, but it's pretty easy to also make one where it isn't.
...
But when music is playing, you can crossover subs at 120 Hz without any sense of localization
...
B.
I wish I found that statement to be true.
I've been trying to raise subs to mains xover freq to 120Hz for a variety of reasons, but the sub-woofers' localization at 120 Hz is far too great for my needs.
This is outdoors, devoid of major reflection problems.
And at low enough SPL, harmonic distortion is not an issue.
Below is a trace from a week ago .....check out the use of an unusually steep slope, to minimize any chance of sub localization (96dB LR LPF @120 Hz).
Disappointingly easy to hear the localization....
Attachments
Those coefficients are for normal angles of incidence. I thought this stuff didn't absorb so well compared to loose stuffing when angles were oblique?
Hey DDF, I'm all ears for more information on the actual acoustical absorption performance of semi-rigid fiberglass, or other high absorption/damping materials.
Hey DDF, I'm all ears for more information on the actual acoustical absorption performance of semi-rigid fiberglass, or other high absorption/damping materials.
Hi Twinter,
Give this model a spin:
Porous Absorber Calculator V1.59
Clearly shows how absorption coeff drops as you move away from normal to the surface (normal = 0 deg). I know I used to have 703/705 data of absorpt coeff vs angle but sorry, can't find it.
To Earl: Hmm, not convinced an inability to measure cabinet radiation in far field is the only criteria. A lower level but long q resonance would be hard to detect far field but the duration of the ringing may make it unmasked for some dynamic signals.
- Status
- This old topic is closed. If you want to reopen this topic, contact a moderator using the "Report Post" button.
- Home
- Loudspeakers
- Multi-Way
- Measuring sound output from speaker cabinet walls