Your example only looks like a "lobe" because it is one dimensional - angle off axis - only in one plane. If you were to look at it as a polar map showing two angles - off axis and around the axis - you would see that the 30 degree "hole" goes away in different planes. If this plot were due to a finite sized piston then the null would be a circle and not be different in different planes. Using the term "lobe" for both effects leads one to believe that they represent the same kind of effect when in fact they don't. Use the term "lobe" if you like, it can usually be determined from the context which effect you are talking about, but I will continue to understand them as two different effects because the results are quite different.
I see what you're saying about this now. If the radiation pattern for a loudspeaker was looked at in a 3 dimensional sense, such as it is for radio antenna , then you would not get any 'lobes' generated by the interference patterns created by the various drivers going in and out of phase in the vertical plane. You would however get 3d lobes generated by the directivity of the drivers.
I always took the term 'lobe' simply to mean the descriptive term used to describe the physical feature on a polar plot. Not that it had some special meaning itself regarding how the subject under test is radiating energy.
If you were looking at a 2D polar plot, like I posted before, and you didn't know what it was you were looking at, apart from it being an energy distribution from a radiating something or other. What terminology would you use to describe what it was you were seeing? I mean I would simply use nulls and lobes to describe the regions of high and low intensity. But from what you're saying, you should only use the word lobe once you know what it is you're looking at?
The degree to which the LC filter, on the output of a class D amplifier, will change vs frequency and the loudspeaker impedance, is obviously related directly to the values used within the LC filter.
The more recent TI products have been designed specifically to try and keep radiated EMI as low as possible through various switching techniques. These have directly lead to the development of products that can actually be used without your traditional LC filter, at reasonable loudspeaker cable lengths, without breaking regulations.
When you go beyond certain cable lengths radiated EMI increases and you break regulations. The only way to get around this is to now add in an LC filter. Now with it's lower inherent EMI design the TI product probably doesn't need anywhere near as severe filtering compared to older designs so the corner frequency of its output filter is much higher. This will directly translate into less frequency response variation, within the audible band, with varying amplifier impedance.
It is too simple to look at this in a lumped fashion as not all class D amplifiers are anywhere close to being the same.
I see what you're saying about this now. If the radiation pattern for a loudspeaker was looked at in a 3 dimensional sense, such as it is for radio antenna , then you would not get any 'lobes' generated by the interference patterns created by the various drivers going in and out of phase in the vertical plane. You would however get 3d lobes generated by the directivity of the drivers.
I always took the term 'lobe' simply to mean the descriptive term used to describe the physical feature on a polar plot. Not that it had some special meaning itself regarding how the subject under test is radiating energy.
If you were looking at a 2D polar plot, like I posted before, and you didn't know what it was you were looking at, apart from it being an energy distribution from a radiating something or other. What terminology would you use to describe what it was you were seeing? I mean I would simply use nulls and lobes to describe the regions of high and low intensity. But from what you're saying, you should only use the word lobe once you know what it is you're looking at?
This is now precisely correct.

You cannot tell what you are looking at in a single variable plot, unless you know what effect you are looking at. When the same tem defines both effects then confusion can be the only result.
I would null to describe the "hole" from non-coincidence and "lobe" to describe the finite size polar response effect. You could also say "crossover null" and "radiation lobes". There is no ambiguity in those terms.
Wave interference, combing filtering, lobing ... take your pick.I see what you're saying about this now. If the radiation pattern for a loudspeaker was looked at in a 3 dimensional sense, such as it is for radio antenna , then you would not get any 'lobes' generated by the interference patterns created by the various drivers going in and out of phase in the vertical plane. You would however get 3d lobes generated by the directivity of the drivers.
I always took the term 'lobe' simply to mean the descriptive term used to describe the physical feature on a polar plot. Not that it had some special meaning itself regarding how the subject under test is radiating energy.
If you were looking at a 2D polar plot, like I posted before, and you didn't know what it was you were looking at, apart from it being an energy distribution from a radiating something or other. What terminology would you use to describe what it was you were seeing? I mean I would simply use nulls and lobes to describe the regions of high and low intensity. But from what you're saying, you should only use the word lobe once you know what it is you're looking at?
I'm not clear on what other "effect" gedlee is alluding to here. Non-coincident drivers are going to produce wave interference as a result of their location to each other ... odd multiples of half wavelengths for instance. While the two drivers will exhibit lobing, the strongest lobe (not null) will be on axis. This by itself doesn't make both drivers coincident "off axis". True on/off axis coincidence requires both driver to share a single point in 3D.
That "slice" or section through the polar represents the centerline of the lobe. Being circular in nature means that retreating from the centerline will cause the lobe to appear narrower and narrower (both hor. and vert) ... but it's still there.
I guess then, due to the context used and the usual posting of 2D polar plots (along with the discussion of the vertical off axis issues created by having two non coincident drivers) that 'lobe' in that sense, isn't particularly inaccurate as it is supposed to be obvious what one is talking about.
Usually there isn't any confusion about such things because no one bothers to go into any detail about the loudspeakers directivity.
I do agree though, that if you were going to discuss a design, where you explicitly wanted to detail both the non coincident aspect and the loudspeakers directivity, that using the same terminology for both could get a little confusing.
Non-coincident drivers are going to produce wave interference as a result of their location to each other
What I am taking it to mean is this.
If you take a single drive unit, lets say a tweeter attached to one of Earl's wave guides, so it exhibits constant directivity and measure it's radiation pattern, you're going to get something that looks a little like a radio antenna primary lobe.
And look a little like this, but for the tweeter, it will show something similar at all frequencies above where it starts to control directivity. The radio antenna will presumably just be designed to work at a specific frequency, or very narrow band of frequencies.

That looks familiar. But. If you now look at this in 3D you end up with something like this (ignoring the blue bit behind the lobe).
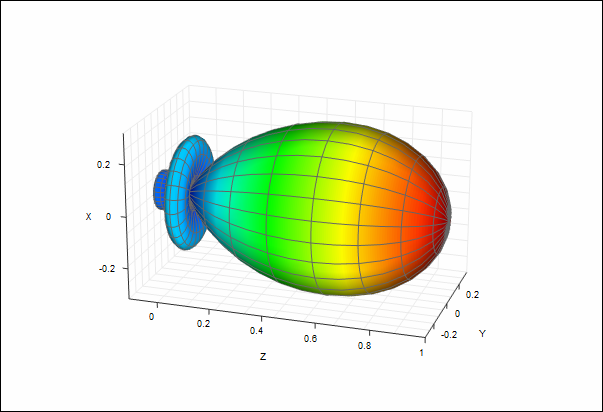
And this is what a lobe actually is.
If you were to create similar plots for the radiation pattern of a single mono pole loudspeaker in free space, then presumably you would end up with a sphere at low frequencies, then as the baffle width becomes significant it would transition into a hemispherical pattern, before narrowing into a cone like above, before continuing to get narrower and narrower.
That would be lobing generated by the piston diameter etc of the object being measured.
Now, if you were to place two non coincident drivers and separated them by a certain distance and crossed them over at the frequency where the wavelength would = the driver separation, then you would end up with a single 2D polar slice similar to the one I posted before.
The thing is, if you viewed this as a 3D chart you would not get standard lobes being formed. If both the drivers were operating with wide dispersion at this frequency, then you would get a single, very wide primary lobe, but it would have slices through it at specific angles where the drivers were going in and out of phase with one another. Kind of like slices of an orange. These slices (or what's left after you've removed a couple for the nulls) aren't actually lobes, they don't look like lobes in a 3D pattern and that's due to how they are created. It's like you have one main lobe, but it's being disturbed by the interference pattern of the two drivers at that specific frequency. The interference pattern obviously vanishes as you go up or down in frequency.
At least that's what I've taken it to mean.
I don't understand the confusion here. The resultant polar "section" represents the destructive output (lobes and nulls) on the surface of the wavefront. While I've come across an attempt to visualize what's happening "inside" the merged plumes (numerous nulls/peaks) ... guess I don't get the relevance.The thing is, if you viewed this as a 3D chart you would not get standard lobes being formed. If both the drivers were operating with wide dispersion at this frequency, then you would get a single, very wide primary lobe, but it would have slices through it at specific angles where the drivers were going in and out of phase with one another. Kind of like slices of an orange. These slices (or what's left after you've removed a couple for the nulls) aren't actually lobes, they don't look like lobes in a 3D pattern and that's due to how they are created. It's like you have one main lobe, but it's being disturbed by the interference pattern of the two drivers at that specific frequency. The interference pattern obviously vanishes as you go up or down in frequency.
At least that's what I've taken it to mean.
The relevance, I am assuming here, is that from a technical point of view, one describes the radiation pattern of the device itself as 'lobing' ie how a drivers natural response changes with respect to its diameter. One could say the loudspeaker is 'lobing' because it's off axis response is falling because of the piston diameter and this occurs in three dimensions.
Earl is saying that if destructive interference is occurring between two non coincident drivers that this isn't called lobing because lobing is used specifically to describe the radiation pattern of the drive units. The drivers could be radiating omni-directionally, where no narrow lobing is present, yet you'd have nulls at certain angles and frequencies. This isn't called lobing as ,technically, something different, some other mechanism, is causing it. Not only this but the 3 dimensional polar plot for this looks completely different to the other lobe looks - this might be the important part.
It's like you've taken two drivers that have their own unique lobing patterns and brought them together. Those patterns describe how they behave and this isn't going to change just because they are now working together. What you're now going to get is something else, but it isn't lobing. It's an interference pattern.
I guess we'll have to ask Earl to clarify, but comb filtering might be the better way to describe it, that is if there is a true technical distinction to what lobing specifically describes.
The wavefront is what we're concerned with. Wave interference causes lobing/comb filtering on the wavefront surface. There is no plume interior except for the layers of lobed wavefronts produced after the first ... like cutting through a head of lettuce if you care to look at it that way. These polar diagrams are snapshots in time. Higher frequency wavelengths rapidly advance off the driver surface. Each one will exhibit the exact same interference pattern .. lobe, comb filtering.
Last edited:
Yes I am aware of that, which is why I had a problem with what Earl was saying to start with, I was agreeing with what you are saying. Earl however is saying that there is a distinction between the two things from a technical point of view and that they shouldn't be lumped together.
So you can see that for all intents and practical purposes, the class D amp LC filter is flat in gain and phase for a typical driver. Thus, if you do your XO actively before the amp, it is a non-issue.
Thanks!
Hi,
Starting from the 1-4 khz OP & high efficienty subjectiv choice with a good combo cd+horn to start around 800 hz. Then trying not to have firstly a upper treble: withe a 1.5 " CD e.g., maybe some 2" (?) ; e.g.: 745ND ?) :
What could be a good choice of XO & driver for the mid-bass driver with a steep 4th order XO or more with modern active devices ? Sealed or OB or cardioid (with EQ for the two last I assume)
2 octaves : 200 to 800 hz ?
3 octaves : 100 to 800 hz ?
more : horn loaded mid-bass cone ?
When I look at the Fs of pro drivers 8" to 12", it's often difficult to put 2 octaves above the Fs for the Xo like often advised to avoid the distorsions ! All have fabric surround which less distorsion free than very low silicon ones !
Can this plan be corrupted with the same quality with a higher cut off of 1 000 hz to 1200 hz ? For trying a higher High-pass : 300 hz ? (300 to 1200 = 2 octaves). Here it can permit to go with a 1" CD ?
Saying that, re-read the posts above about dynamic, distorsion and max spl: some says that hifi driver have no problem with distorsion when dynamic peaks of 105 db (most of all listen to a middle level of around 75 db) : is ist a choice with active devices to lower the CD efficienty to match good hifi drivers :
- Neo 8s / Neo 10
- wide banders à la Alpair 7 or 10
- ceramic or good nordic ones à la SS, Vifa, SEAS
- or some lower effcienty one of the pro world like PHL1220 ?
Sorry many questions in one... I'm turning around the problem of a good mid-bass with maybe non compatible needs : details and micro dynamics like subjective mid-bass dynamic and impacts...
Here the cd driver will be here just for horn directivity and avoiding a upper treble! maybe a waste of time : just keep the SS 10F and stop writting ? With the best trebles J Krupp or T. Graeven "advertise" ? With more easier choice for the mid-bass (hifi driver but no OB-design because the laxke of effcienty for EQ in relation to the need of dynamic gap without distorsion !
Last edited:
Or... Do I change the first mid-bass subjectiv needs for an other philosophy as I can't not try all the best ideas of the experienced fellows of DIYAUDIO and i don't want to do worst than my actual commercial speaker (Tunned Boston Acoustic Lynnfield 400 L) :
Here it comes to be OT but such philosophy will be : try to choose a ready made design which start with the idea of the best phase (the more linear by choosing drivers, enclosures, and FIR filter ameliorations and good total impedance curve instead choosing drivers and cuts off ?
Here it comes to be OT but such philosophy will be : try to choose a ready made design which start with the idea of the best phase (the more linear by choosing drivers, enclosures, and FIR filter ameliorations and good total impedance curve instead choosing drivers and cuts off ?
Last edited:
I guess we'll have to ask Earl to clarify, but comb filtering might be the better way to describe it, that is if there is a true technical distinction to what lobing specifically describes.
You have it exactly correct so I guess my explanation is sufficient for someone to follow it.
I view comb filtering as an electrical effect, i.e. in one dimension. This is a spatial effect - always far more difficult to visualize. The lobes, as seen in the polar balloon you have shown go all the way around the source. The non-coincident interference from two sources would look completely different. It would be two dimples pushed into the side of the balloon. This assumes that the frequency is low enough that the sources don't have radiation lobes themselves - like point sources. If the frequency is higher and/or the sources are larger so that they do have radiation lobes then the net result would be the superposition of the dimples balloon and the lobbing balloon.
If you see this distinction then you understand how radiation at the crossover works . If you don't see the distinction then you don't completely understand how polar radiation works.
These polar diagrams are snapshots in time. Higher frequency wavelengths rapidly advance off the driver surface. Each one will exhibit the exact same interference pattern .. lobe, comb filtering.
This is entirely incorrect. The polar patterns are steady state magnitude response plots. They are not time domain events.
Last edited:
This is entirely incorrect. The polar patterns are steady state magnitude response plots. They are not time domain events.
Is there a significant difference regarding polar patterns if one looks at steady state vs. behavior in time?
Dr. Dan Russel has a collection of nice animations of loudspeaker radiation etc. basics
Dan Russell's Acoustics and Vibration Animations
Dr. Wolfgang Klippel has something to tell too
http://www.klippel.de/uploads/media/KLIPPEL_Sound_Radiation_Poster_01.pdf
Dan Russell's Acoustics and Vibration Animations
Dr. Wolfgang Klippel has something to tell too
http://www.klippel.de/uploads/media/KLIPPEL_Sound_Radiation_Poster_01.pdf
Last edited:
Is there a significant difference regarding polar patterns if one looks at steady state vs. behavior in time?
Not if you understand the differences. You are still looking at the wavefronts in a single plane and that appears to be the root of the confusion and why it is so hard to show what is actually happening. Also, if you look at interference patterns in typical pictures, these are by necessity near field and can be quite different than the far field patterns.
IMO, looking at the wavefront interference patterns is not very useful in this discussion. The two effects that we are talking about will look the same because this is, by necessity, only ever a single plane. What we want to understand is how the sound radiates in two spatial angles. You just cannot look at a single plane and know what is happening in all the others unless you know how the pattern was created.
Is there a significant difference regarding polar patterns if one looks at steady state vs. behavior in time?
I think you will only confuse yourself if you try and consider polar patterns as time domain related. Most of the polar plots we look at are defined for a single frequency, so they are steady state plots (as if the 1kHz tone has been on for all time, etc.).
Now there is a time domain cause for typical interference lobing, in that if 2 (or more) units are given an impulse then their response at any point in space is defined by the relative path lengths to the observer, or by the Fourier transform of the pulse train determined by their geometry. In this regard lobing is also analogous to aliasing, with a repetition of the DFT pattern often seen if the drivers overlap for a wide enough frequency region.
Note that polar patterns can be calculated for near field or far field conditions. Most calculated polars are done in the far field. Near field polars of arrays are interesting because the lobes are usually considerably broader. Measured polars, in practice, tend to be in the middle ground, but tending towards the far-field performance.
I agree with Earl that estimating the total polar pattern in 3D takes some knowledge of what the array is. For example, the 3D plot that 5th Element showed is an end fire in the horizontal direction. This is implied by the axis of symmetry that for that pattern must line up with the line of drivers.
David
- Status
- This old topic is closed. If you want to reopen this topic, contact a moderator using the "Report Post" button.
- Home
- Loudspeakers
- Multi-Way
- Why crossover in the 1-4khz range?