I wish that it had a white noise file and a continual display or a timed refresh
ARTA will do that, the demo version is free and its a full working version (minus saving).
I haven't made it all the way through this thread of the measurements thread yet, so I apologize in advance if this has already been discussed. I'm coming from an older measurement package, Loudspeaker Lab 2. In that software, you could chose the number of repetitions it would make for an MLS measurement. It would then average the measurements and return the impulse response. I think I ended up using somewhere around 12-15 measurements based on the recommendation of the developer. I haven't found a similar functionality in HOLM. Is it totally unnecessary? Does increasing the MLS length accomplish something similar to averaging multiple measurements of a shorter MLS length? What is a good way to determine how long to set the MLS length?
thanks!
Dan
thanks!
Dan
In that software, you could chose the number of repetitions it would make for an MLS measurement. It would then average the measurements and return the impulse response.
Earlier versions of HOLM had this. But it dropped out a few versions ago. I asked for its return, but got no answer.
I'm not sure it actually gave better results, but I felt better about it.
")
I use that same function in LAUD, the precursor to Praxis. I always use an 8-measurement average. The primary benefit of doing this is to lower the noise floor, since most noise is considered to be uncorrelated. I believe that each time that you double the number of measurements in the average that you lower the noise floor by 3db. It does tend to help the low end of the measurement for SPL, since resolution is worse and background noise starts to become a problem with the longer wavelengths starting to appear more correlated. I'd say that above about 1K it's not of much benefit to do an average.I haven't made it all the way through this thread of the measurements thread yet, so I apologize in advance if this has already been discussed. I'm coming from an older measurement package, Loudspeaker Lab 2. In that software, you could chose the number of repetitions it would make for an MLS measurement. It would then average the measurements and return the impulse response. I think I ended up using somewhere around 12-15 measurements based on the recommendation of the developer. I haven't found a similar functionality in HOLM. Is it totally unnecessary? Does increasing the MLS length accomplish something similar to averaging multiple measurements of a shorter MLS length? What is a good way to determine how long to set the MLS length?
thanks!
Dan
Dave
I use that same function in LAUD, the precursor to Praxis. I always use an 8-measurement average. The primary benefit of doing this is to lower the noise floor, since most noise is considered to be uncorrelated. I believe that each time that you double the number of measurements in the average that you lower the noise floor by 3db. It does tend to help the low end of the measurement for SPL, since resolution is worse and background noise starts to become a problem with the longer wavelengths starting to appear more correlated. I'd say that above about 1K it's not of much benefit to do an average.
Dave
Does increasing MLS length lower the noise floor as well? I'm only somewhat familiar with how the impulse is derived from MLS data, but I haven't figured out what MLS length makes the most sense for a given reflection free time window. Should MLS length just be set at something a little longer than the time to the first reflection, assuming anechoic data is desired? Or, does a longer MLS length equate to some reduction in the noise floor similar to multiple meaurements?
Dan
Member
Joined 2009
hey guys.
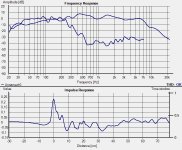
I'm trying to get measurements of my system in my room.
It is a 3-way, crossed over with a 2nd order Linkwitz-Riley at 400Hz and 4th order at 6600Hz.
The blue line is a gated response and the red is raw, smoothed.

the green is with the phase flipped up 180deg at the woofers. The phase looks better but the bass is lacking.

Is it normal in pic1 for the phase to be flipped at 1500Hz when there's no crossover near? What am I doing wrong and how can I improve on this?
I'm trying to get measurements of my system in my room.
It is a 3-way, crossed over with a 2nd order Linkwitz-Riley at 400Hz and 4th order at 6600Hz.
The blue line is a gated response and the red is raw, smoothed.
the green is with the phase flipped up 180deg at the woofers. The phase looks better but the bass is lacking.
Is it normal in pic1 for the phase to be flipped at 1500Hz when there's no crossover near? What am I doing wrong and how can I improve on this?
Hi boris,
i do not think you are doing something "wrong" necessarily,
since the phase is rotating continously in your measurement.
Since only the minimum phase is displayed in the range
from -180 to +180 degrees there is a flip.
The phase rotation may be the summed effects from your
4th order lowpass and the phase rotation from your midrange
driver.
Kind Regards
I am trying "HolmImpulse" in the last days and i am
very happy using it.
Since i cannot avoid doing some measurements in an
unsuitable room at present - house is being rebuilt ... -
i also switched to "Log Sweep" instead of "MLS", which
i was using with my former software.
Log Sweep yields more reproducible results and when
gating is omitted - which i do sometimes since i cannot
avoid some rather early reflections right now - the
result is better correlated with sonic impression and
somewhat less dependent from room reflection and
resonances IMO.
I would like to have CSDs since i value them highly
and have looked for additional software to feed the
impulse response with.
Unfortunately i did not find exactly, what i was
looking for.
These three might be interesting
Wavesurfer:
WaveSurfer
Wavosaur:
Wavosaur 1.0.5.0 Download - Freeware Files.com - Audio & Video Category
Spectrum Lab:
DL4YHF's Audio Spectrum Analyser
"Wave surfer"
is a speech scientist tool able to plot
colored sonagrams. I found those interesting in viewing
the spectral decay, although it is not the common form of
3D presentation.
The display resolution is good, but the frequency
scaling is rather speech oriented and fixed. You can adjust
the number of samples used for the FFT, so you can choose
whether to focus time or frequency domain when visualizing
spectral decay.
You can also slice through the impulse response and get
spectra during decay in an 2 dimensional graph.
I use a 16 bit .wav file which can be written by Holmimpulse
using the "Export" option for the impulse response.
"Wavosaur"
Same .wav file can be fed to "Wavosaur".
It creates a - real - fancy looking 3D spectrum whithout
readable scale. Cool but rather unusable IMO. The
Program is not meant for signal anylysis but as a
signal editor for musicians whith some analytic
capabilities.
"Spectrum Lab"
Is designed for the analysis of real time spectral data
accquisition. The tool would surely be able to to the job.
But i simply did not manage to get through all that
functionality to do my simple task ...
--------------------------------------------------------------------------
@KSTR: When you used the S-Transform tool, how did you
save the IR and what extension did you use when loading ?
That S-Transform program does not accept .wav, so you must
have used some trick ?
--------------------------------------------------------------------------
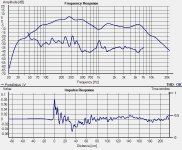
Attached a frequency response of a prototype bending wave
transducer from ungated raw IR. The phase shift (not shown)
and rolloff at the upper end is due to experimentally attaching
the exciter to the panel with kneading mass instead of lightweight
and harder glue ... Smoothing is 1/3 octave, second graph is THD.
Kind Regards
very happy using it.
Since i cannot avoid doing some measurements in an
unsuitable room at present - house is being rebuilt ... -
i also switched to "Log Sweep" instead of "MLS", which
i was using with my former software.
Log Sweep yields more reproducible results and when
gating is omitted - which i do sometimes since i cannot
avoid some rather early reflections right now - the
result is better correlated with sonic impression and
somewhat less dependent from room reflection and
resonances IMO.
I would like to have CSDs since i value them highly
and have looked for additional software to feed the
impulse response with.
Unfortunately i did not find exactly, what i was
looking for.
These three might be interesting
Wavesurfer:
WaveSurfer
Wavosaur:
Wavosaur 1.0.5.0 Download - Freeware Files.com - Audio & Video Category
Spectrum Lab:
DL4YHF's Audio Spectrum Analyser
"Wave surfer"
is a speech scientist tool able to plot
colored sonagrams. I found those interesting in viewing
the spectral decay, although it is not the common form of
3D presentation.
The display resolution is good, but the frequency
scaling is rather speech oriented and fixed. You can adjust
the number of samples used for the FFT, so you can choose
whether to focus time or frequency domain when visualizing
spectral decay.
You can also slice through the impulse response and get
spectra during decay in an 2 dimensional graph.
I use a 16 bit .wav file which can be written by Holmimpulse
using the "Export" option for the impulse response.
"Wavosaur"
Same .wav file can be fed to "Wavosaur".
It creates a - real - fancy looking 3D spectrum whithout
readable scale. Cool but rather unusable IMO. The
Program is not meant for signal anylysis but as a
signal editor for musicians whith some analytic
capabilities.
"Spectrum Lab"
Is designed for the analysis of real time spectral data
accquisition. The tool would surely be able to to the job.
But i simply did not manage to get through all that
functionality to do my simple task ...
--------------------------------------------------------------------------
@KSTR: When you used the S-Transform tool, how did you
save the IR and what extension did you use when loading ?
That S-Transform program does not accept .wav, so you must
have used some trick ?
--------------------------------------------------------------------------
Attached a frequency response of a prototype bending wave
transducer from ungated raw IR. The phase shift (not shown)
and rolloff at the upper end is due to experimentally attaching
the exciter to the panel with kneading mass instead of lightweight
and harder glue ... Smoothing is 1/3 octave, second graph is THD.
Kind Regards
Attachments
HolmImpulse pass band phase inversion
Recently conducted some HI tests starting to use the software and discovered a phase inversion within my 2-way woofer's passband at around 400 hz.
I'm running the test in a 13 sq. ft room with the speaker oriented diagonally corner-to-corner to minimize reflection/mode effects. The speaker has a 2nd order LP and a 3rd order HP with conventional topology.
I wonder if the 400 hz phase inversion is being caused by acoustic effects such as a room mode or diffraction. The other phase inversion is at the expected crossover point of about 2200 hz.
Any ideas as to the cause?
Something must have gone wrong, during THD
measurement the last time, but since i take the
"Protect your ears!"
serious - you all should - during log sweeping,
i must have missed that something was already
clipping ... Oh my !
measurement the last time, but since i take the
"Protect your ears!"
serious - you all should - during log sweeping,
i must have missed that something was already
clipping ... Oh my !
Attachments
Last edited:
I guess your voice coil inductance is not compensated in the
crossover ... ?
The moving mass of the driver resembles a capacitor at the
terminals (look for "equivalent circuit" of a dynamic driver).
There is a frequency for every driver, where that capacitive
reactance is equal but opposite in sign to the inductive
reactance of the voice coil: Then we have a resonance.
If this is the reason, you may compensate VC inductance,
which is often a good idea, since it makes a crossover to
behave the way it is calculated (usually with resistive load).
Other effects may play a role, but i guess that driver
should not suffer from cone breakup and such things
at a frequency that low.
Kind Regards
Hi Oliver. Nice finds on the software. I've only seen one of those before.
But after looking at so many, I just use ARTA. It does the waterfalls and spectrograms just fine. You've tried it, I suppose?
Glad you fixed your plot! That big rise in the THD had me worried. Is this an NXT type panel? Balsa wood?
But after looking at so many, I just use ARTA. It does the waterfalls and spectrograms just fine. You've tried it, I suppose?
Glad you fixed your plot! That big rise in the THD had me worried. Is this an NXT type panel? Balsa wood?
Thanks for the tip in the woofer inductance effects.
If you mean do I have a zobel in the woofer circuit? I don't. Would a zobel negate that phase inversion?
Better question yet - should I just leave well enough alone?
If you mean do I have a zobel in the woofer circuit? I don't. Would a zobel negate that phase inversion?
Better question yet - should I just leave well enough alone?
I guess your voice coil inductance is not compensated in the
crossover ... ?
The moving mass of the driver resembles a capacitor at the
terminals (look for "equivalent circuit" of a dynamic driver).
There is a frequency for every driver, where that capacitive
reactance is equal but opposite in sign to the inductive
reactance of the voice coil: Then we have a resonance.
If this is the reason, you may compensate VC inductance,
which is often a good idea, since it makes a crossover to
behave the way it is calculated (usually with resistive load).
Other effects may play a role, but i guess that driver
should not suffer from cone breakup and such things
at a frequency that low.
Kind Regards
- Home
- Design & Build
- Software Tools
- HOLMImpulse: Measurements in practice